Before the Ballot 2027
The SysIN Nigeria States Report compares living conditions, public finances, opportunity and civic life across Nigeria’s 36 states and the FCT ahead of the 2027 elections. More federal money meets doubled prices and rising insecurity.
Executive summary
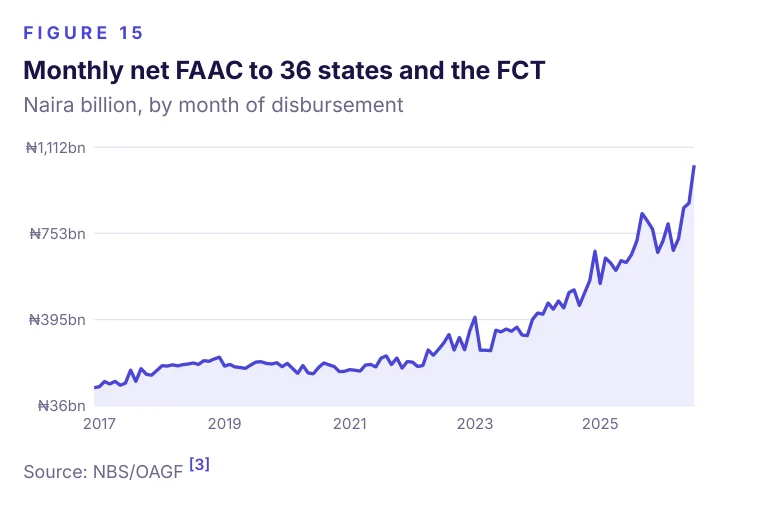
Average monthly net FAAC transfers to the 36 state governments and the FCT rose from ₦305 billion in the year before the May 2023 subsidy removal to ₦793 billion between August 2025 and July 2026 [3]. Adjusting each state's receipts for its own consumer prices, the median state gained 49% in real terms. Akwa Ibom, Delta and Rivers received less in real terms than before, because their earlier receipts were already high and prices rose faster than their transfers. The largest real gains were in Lagos, Plateau and Osun; on the FAAC Windfall vertical, which also weighs the gain per person and deductions, Taraba, Nasarawa and Kwara score highest.
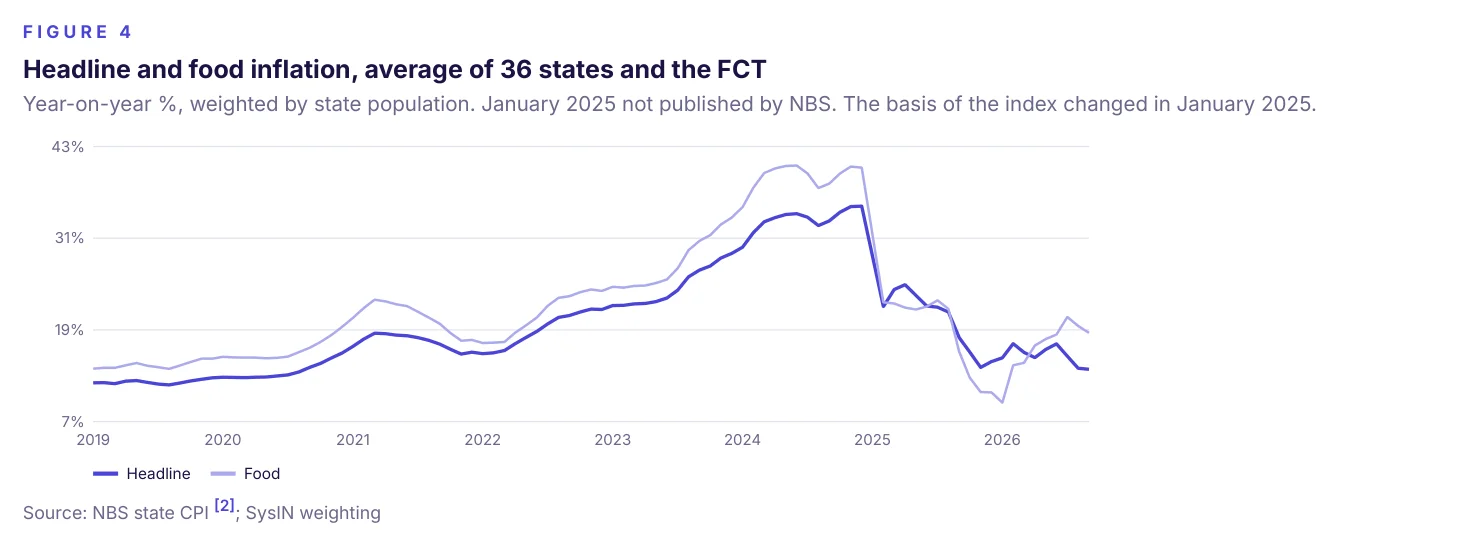
Across states, consumer prices rose by a median of 100% between May 2023 and September 2026, from 76% in Taraba to 122% in Imo [2]. Inflation has eased: average headline inflation over the past twelve months was 15.2%, down from 25.7% a year earlier. Prices still rose fastest in Zamfara, Yobe and Enugu, and most gently in Borno, Kebbi and Jigawa.
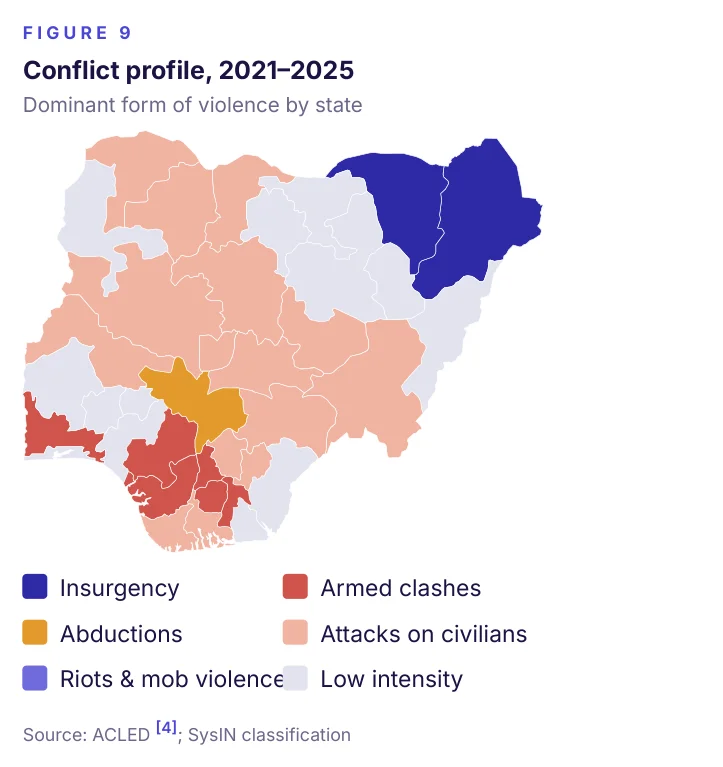
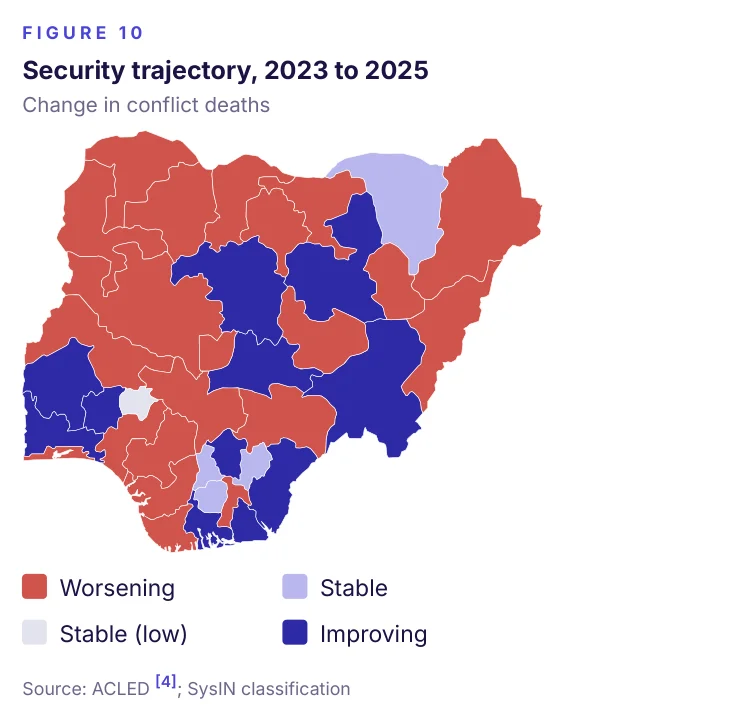
ACLED recorded 15,777 conflict deaths in 2025, against 8,872 in 2023, and 12,802 in the first ten months of 2026 [4]. Five states Borno, Zamfara, Katsina, Niger and Sokoto — accounted for 69% of 2025 deaths. Relative to population, Borno and Zamfara had the highest conflict death rates, each above 40 deaths per 100,000 people. 24 of the 37 recorded more conflict deaths in 2025 than in 2023, and in 21 the increase exceeded 25%. Zamfara, Katsina and Niger carry the highest kidnapping risk.
The 35 states covered by BudgIT's 2025 edition collected ₦3.0 trillion in internally generated revenue (IGR) in 2024, 42% of it in Lagos [1]. For the median state, FAAC transfers made up 75% of total revenue, and for 11 states the share exceeded 80%. Total state debt stood at ₦10.6 trillion at the end of 2024; 24 states held more than half of it in foreign currency.
The median state devoted 53% of its 2024 spending to capital projects, with Anambra, Ebonyi and Enugu above 69% and Ondo, Cross River and Kogi below 23% [1]. On the Value for the Windfall composite, which compares each state's real windfall with changes in security, prices and capital spending, Abia, Adamawa and Taraba achieved the most relative to their windfall; Kwara, Niger and Zamfara the least.
Under-five mortality ranges from 15 deaths per 1,000 live births in Lagos to 202 in Sokoto [1]. Between 2019 and 2021, the share of school candidates achieving five WAEC credits including English and Mathematics ranged from 89% in Abia to 28% in Jigawa [6]. Lagos, Rivers and Ogun lead the Investability Index, which combines fiscal strength, security, investment activity and financial access.
INEC has scheduled presidential and National Assembly elections for 16 January 2027 and governorship and State Assembly elections for 6 February 2027 [13]. In 2023 the presidential vote split evenly: APC, PDP and LP each won 12 of the 37 states and NNPP won one [12]. SysIN classifies 9 states as swing states and 12 as competitive. On the Election Violence Risk composite, which combines competitiveness, past election-period violence and current unrest, Bayelsa, Benue, FCT, Kwara, Lagos, Nasarawa, Osun, Plateau and Rivers are on the high-risk watch list.
Key findings
Federal money rose, but real gains varied
Average monthly net FAAC transfers rose from ₦305bn before subsidy removal to ₦793bn in August 2025–July 2026. The median state gained 49% in real terms; Akwa Ibom, Delta and Rivers received less after inflation.
Consumer prices roughly doubled
The median rise in state consumer prices was 100% between May 2023 and September 2026, ranging from 76% in Taraba to 122% in Imo.
Insecurity weighs heavily on state outcomes
Conflict deaths rose from 8,872 in 2023 to 15,777 in 2025. Borno, Zamfara, Katsina, Niger and Sokoto accounted for 69% of 2025 deaths.
State finances remain transfer-dependent
FAAC supplied 75% of revenue for the median state, and more than 80% in 11 states. Lagos accounted for 42% of internally generated revenue collected by the 35 states with 2024 data.
Conditions and investability tell different stories
Akwa Ibom leads the SysIN State Index at 68.8; Zamfara is last at 28.1. Lagos ranks joint 18th on that index but leads the Investability Index.
Election risk is a watch list, not a prediction
Bayelsa, Benue, FCT, Kwara, Lagos, Nasarawa, Osun, Plateau and Rivers form the high-risk watch list. The composite signals where observers should watch closely; it does not predict that violence will occur.
| Rank | State | Index | Band | V1 Cost of living | V2 Safety | V8 Spending | V6 Self-reliance | V7 Debt safety |
|---|---|---|---|---|---|---|---|---|
| 1 | Akwa Ibom | 68.8 | Leading | 54 | 97 | 69 | 18 | 96 |
| 2 | Jigawa | 68.4 | Leading | 87 | 98 | 43 | 18 | 72 |
| 3 | Ebonyi | 67.8 | Leading | 71 | 94 | 68 | 24 | 62 |
| 4 | Abia | 65.9 | Leading | 45 | 89 | 91 | 35 | 60 |
| 5 | Taraba | 65.5 | Leading | 93 | 84 | 39 | 10 | 80 |
| 6 | Rivers† | 64.9 | Leading | 28 | 96 | 62 | 67 | 78 |
| 7 | Enugu | 64.6 | Leading | 22 | 92 | 64 | 89 | 67 |
| 8 | Gombe | 64.4 | Strong | 57 | 96 | 61 | 12 | 80 |
| 9 | Bayelsa | 64.1 | Strong | 23 | 93 | 86 | 49 | 72 |
| 10 | Nasarawa | 62.2 | Strong | 68 | 85 | 46 | 38 | 61 |
| 11 | Kano | 61.6 | Strong | 59 | 94 | 38 | 26 | 79 |
| 12 | Bauchi | 61.2 | Strong | 70 | 97 | 51 | 19 | 43 |
| 13 | Edo | 59.7 | Strong | 67 | 83 | 65 | 40 | 22 |
| 14 | Anambra | 59.3 | Strong | 45 | 87 | 65 | 17 | 72 |
| 15 | Delta | 59.2 | Middle | 24 | 86 | 61 | 40 | 91 |
| 16 | Ogun | 58.6 | Middle | 55 | 96 | 21 | 83 | 28 |
| 17 | Oyo | 58.4 | Middle | 49 | 98 | 34 | 17 | 82 |
| 18 | Lagos | 57.8 | Middle | 27 | 90 | 58 | 90 | 21 |
| 18 | Imo | 57.8 | Middle | 46 | 89 | 50 | 28 | 66 |
| 20 | Ekiti | 56.6 | Middle | 46 | 98 | 52 | 19 | 49 |
| 20 | Kebbi | 56.6 | Middle | 81 | 74 | 32 | 4 | 72 |
| 22 | Osun | 56.0 | Lagging | 40 | 96 | 33 | 35 | 69 |
| 23 | Yobe | 54.4 | Lagging | 51 | 74 | 44 | 4 | 91 |
| 24 | Kogi | 52.3 | Lagging | 52 | 75 | 30 | 31 | 65 |
| 25 | Cross River | 49.4 | Lagging | 51 | 97 | 22 | 29 | 24 |
| 26 | Ondo | 48.7 | Lagging | 41 | 90 | 23 | 24 | 52 |
| 27 | Adamawa | 47.8 | Lagging | 29 | 85 | 46 | 19 | 49 |
| 28 | Borno | 45.9 | Lagging | 92 | 1 | 46 | 19 | 71 |
| 29 | Kwara | 45.2 | Critical | 24 | 39 | 57 | 43 | 79 |
| 30 | Katsina | 45.0 | Critical | 76 | 10 | 50 | 16 | 75 |
| 31 | Kaduna | 44.1 | Critical | 39 | 78 | 44 | 25 | 16 |
| 32 | Plateau | 41.2 | Critical | 55 | 50 | 14 | 19 | 62 |
| 33 | Niger | 39.8 | Critical | 36 | 25 | 55 | 15 | 76 |
| 34 | Benue | 36.7 | Critical | 33 | 50 | 35 | 7 | 52 |
| 35 | Sokoto | 34.4 | Critical | 46 | 28 | 30 | 6 | 59 |
| 36 | Zamfara | 28.1 | Critical | 17 | 0 | 39 | 16 | 90 |
| – | FCT | – | Not ranked | 55 | 85 | – | – | – |
How to read this report
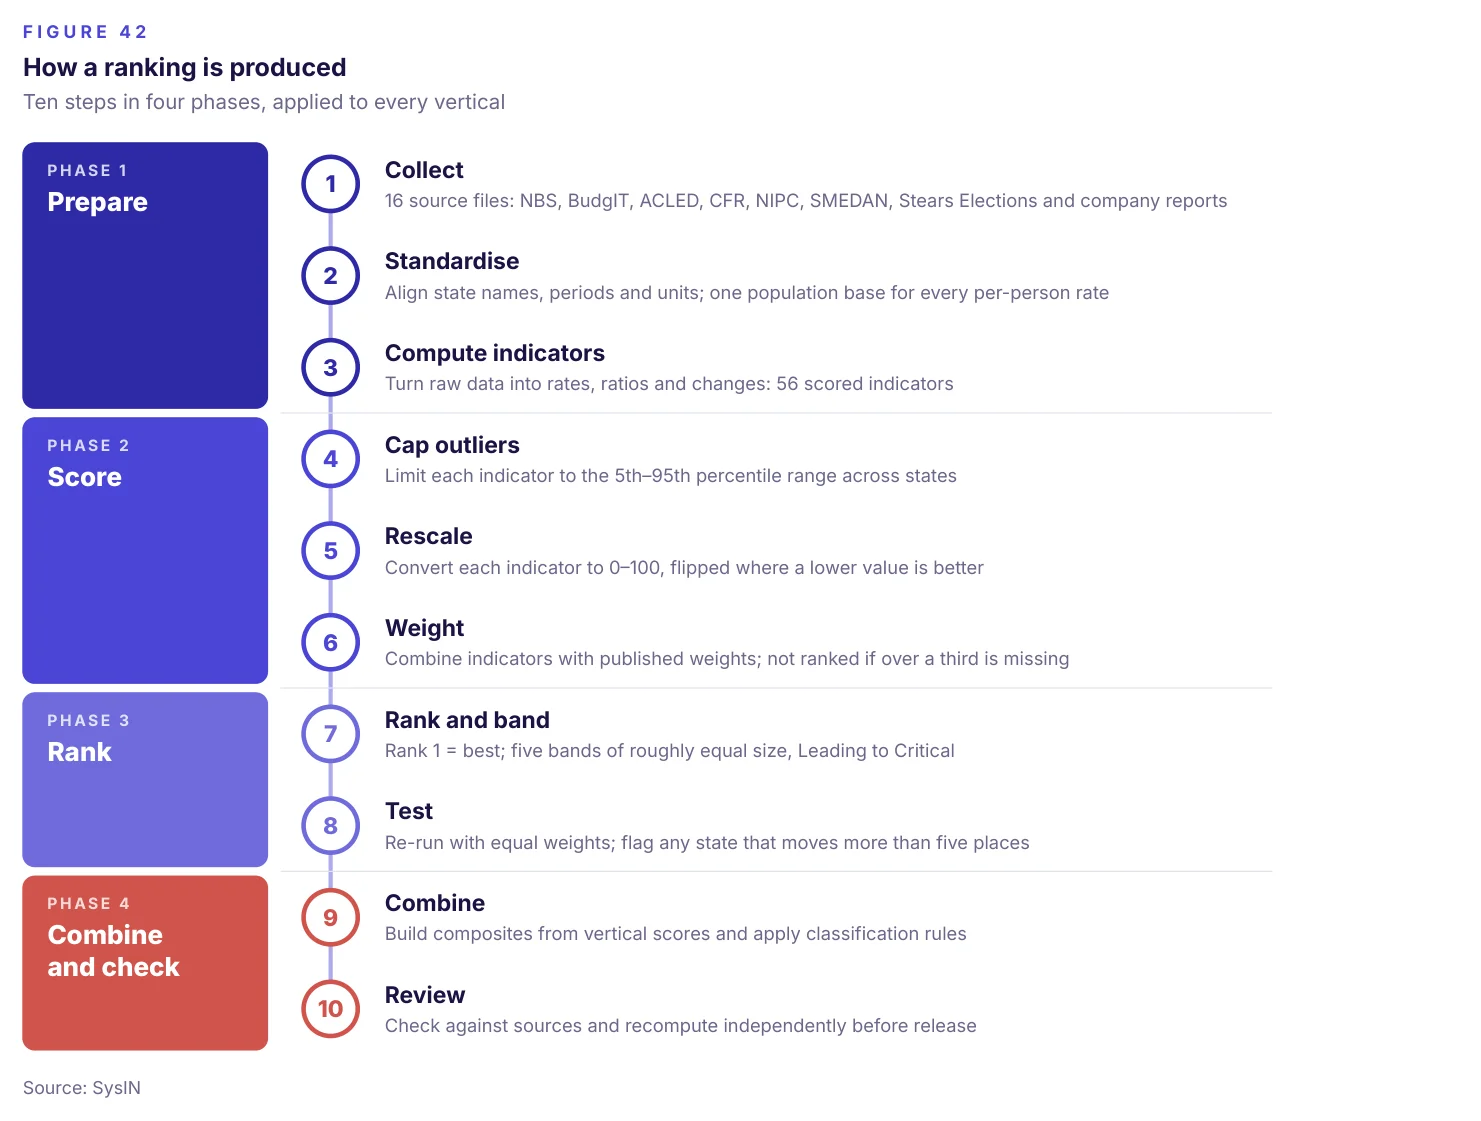
Before the Ballot 2027 ranks Nigeria's 36 states and the Federal Capital Territory (FCT) ahead of the January and February 2027 elections. It looks at the things residents feel most directly: what they pay for food and fuel, how safe they are, what their governments do with public money, and the opportunities open to them. It combines 16 public data sources holding 610 indicators, applies one published method, and reports every result with its source.
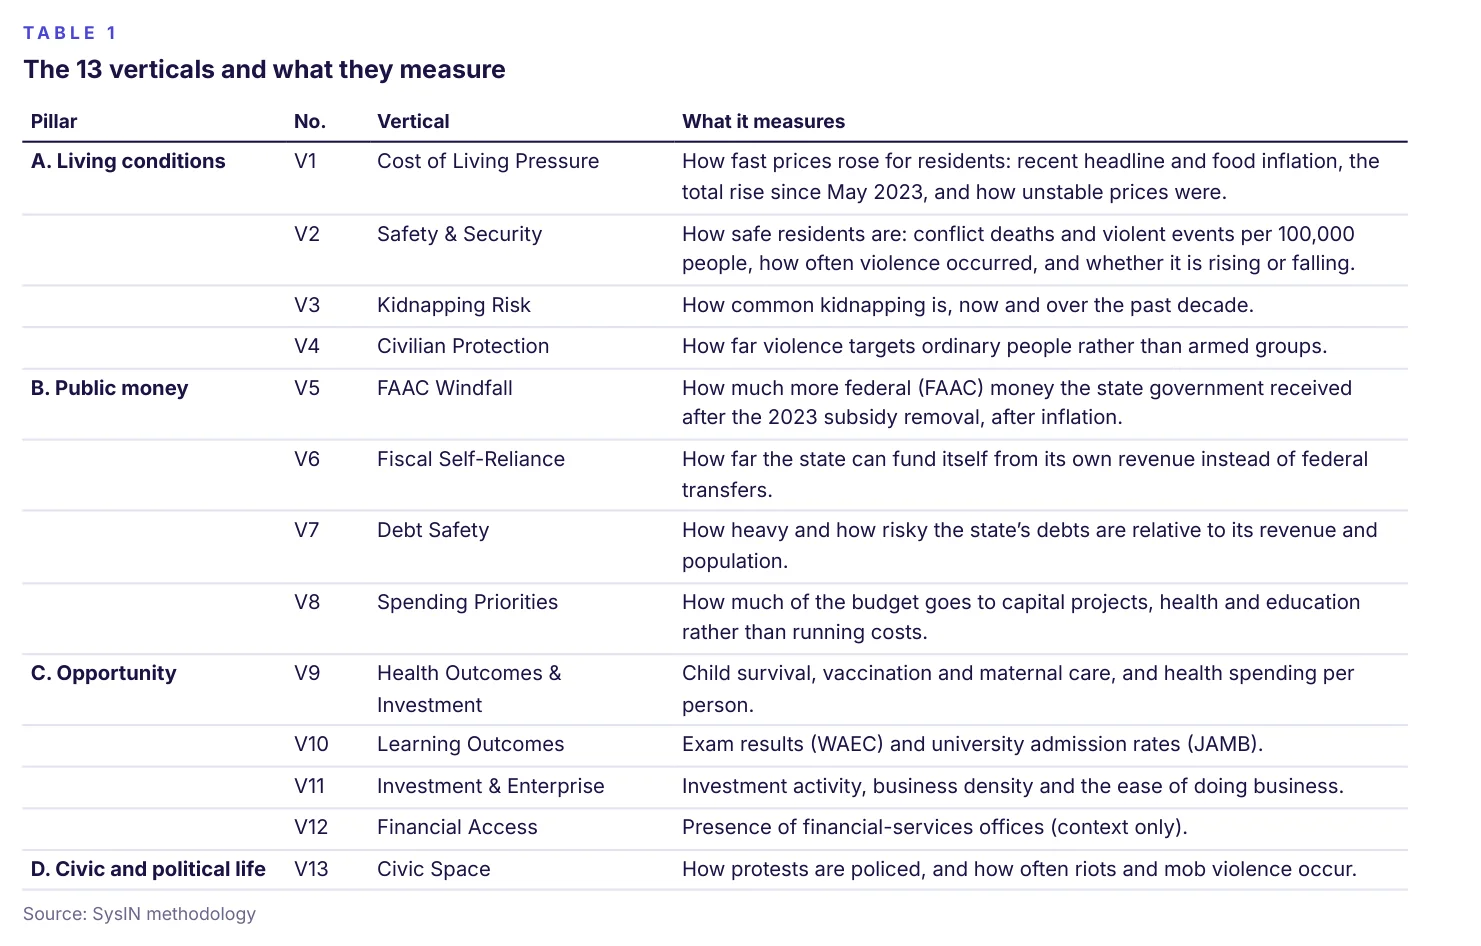
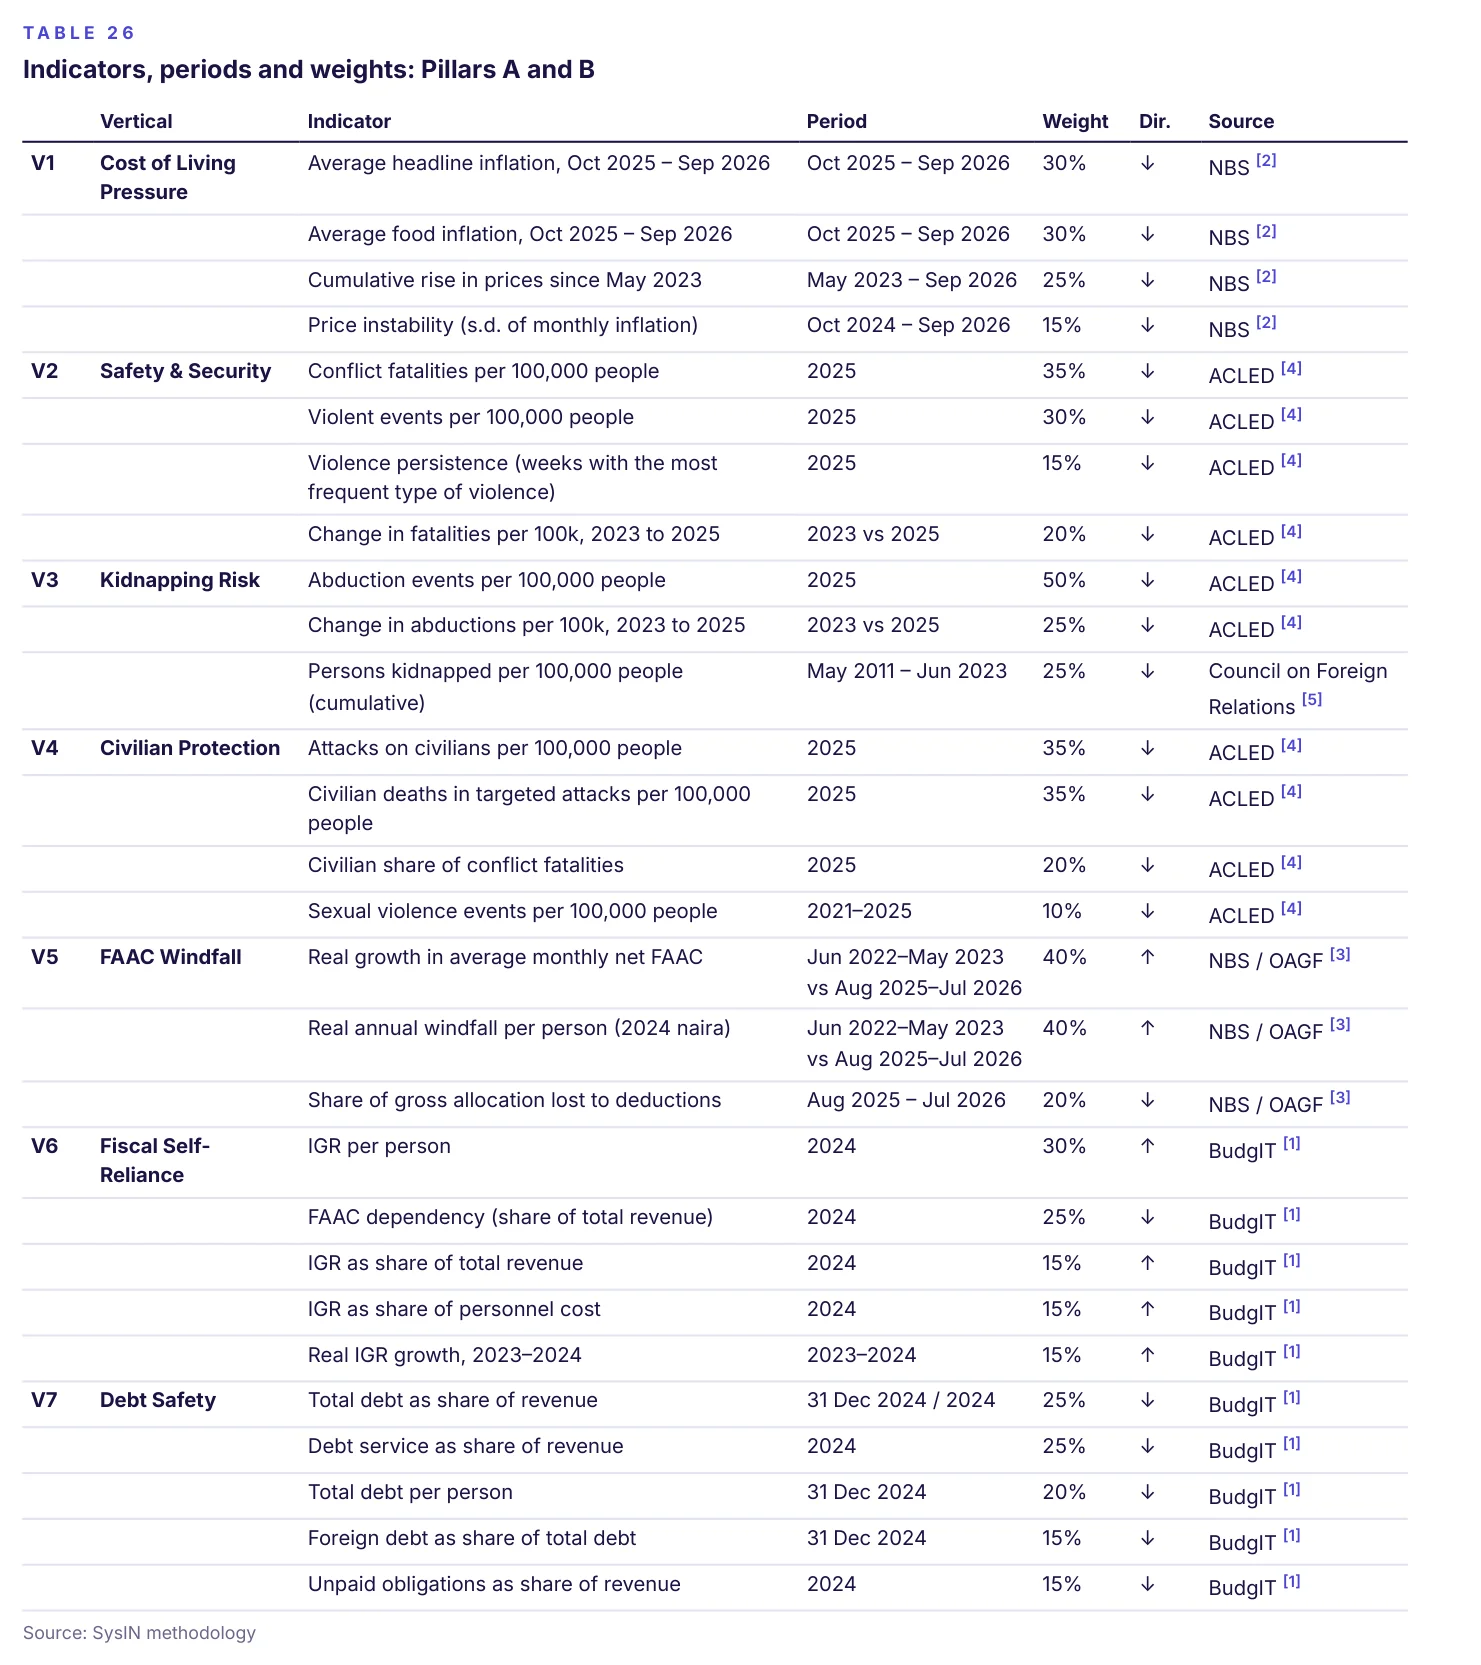
A vertical is one theme on which all states are measured and ranked, such as the cost of living or debt. Each vertical brings together two to seven related indicators, converts them to a common 0–100 scale and combines them, using published weights, into a single score. A higher score is always better. The report has 13 verticals, grouped into four pillars: living conditions, public money, opportunity, and civic and political life.
The same indicators and weights apply to every state. Rankings describe conditions, not government effort or intent. Some inputs are dated or incomplete; the FCT is not ranked on the headline index because BudgIT does not report its finances, and Rivers uses 2023 state-finance data.
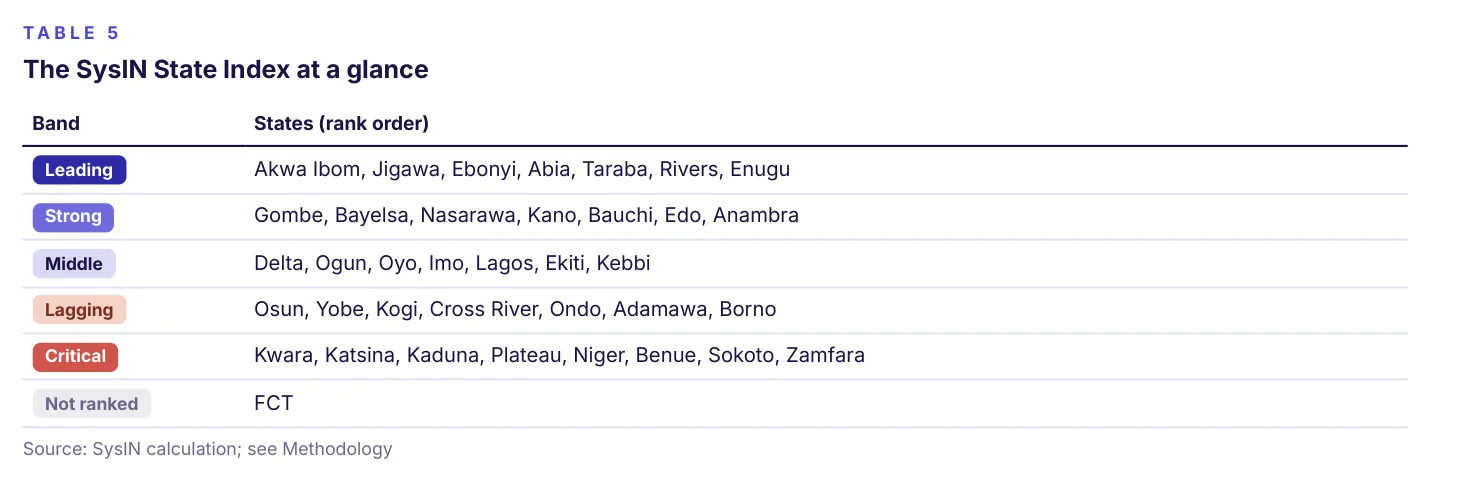
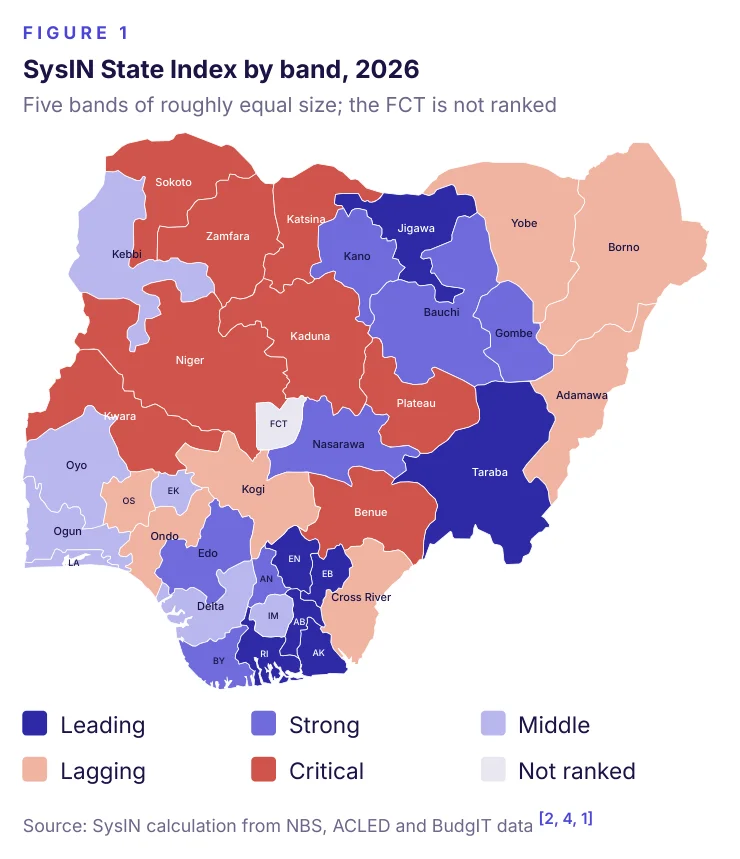
The SysIN State Index
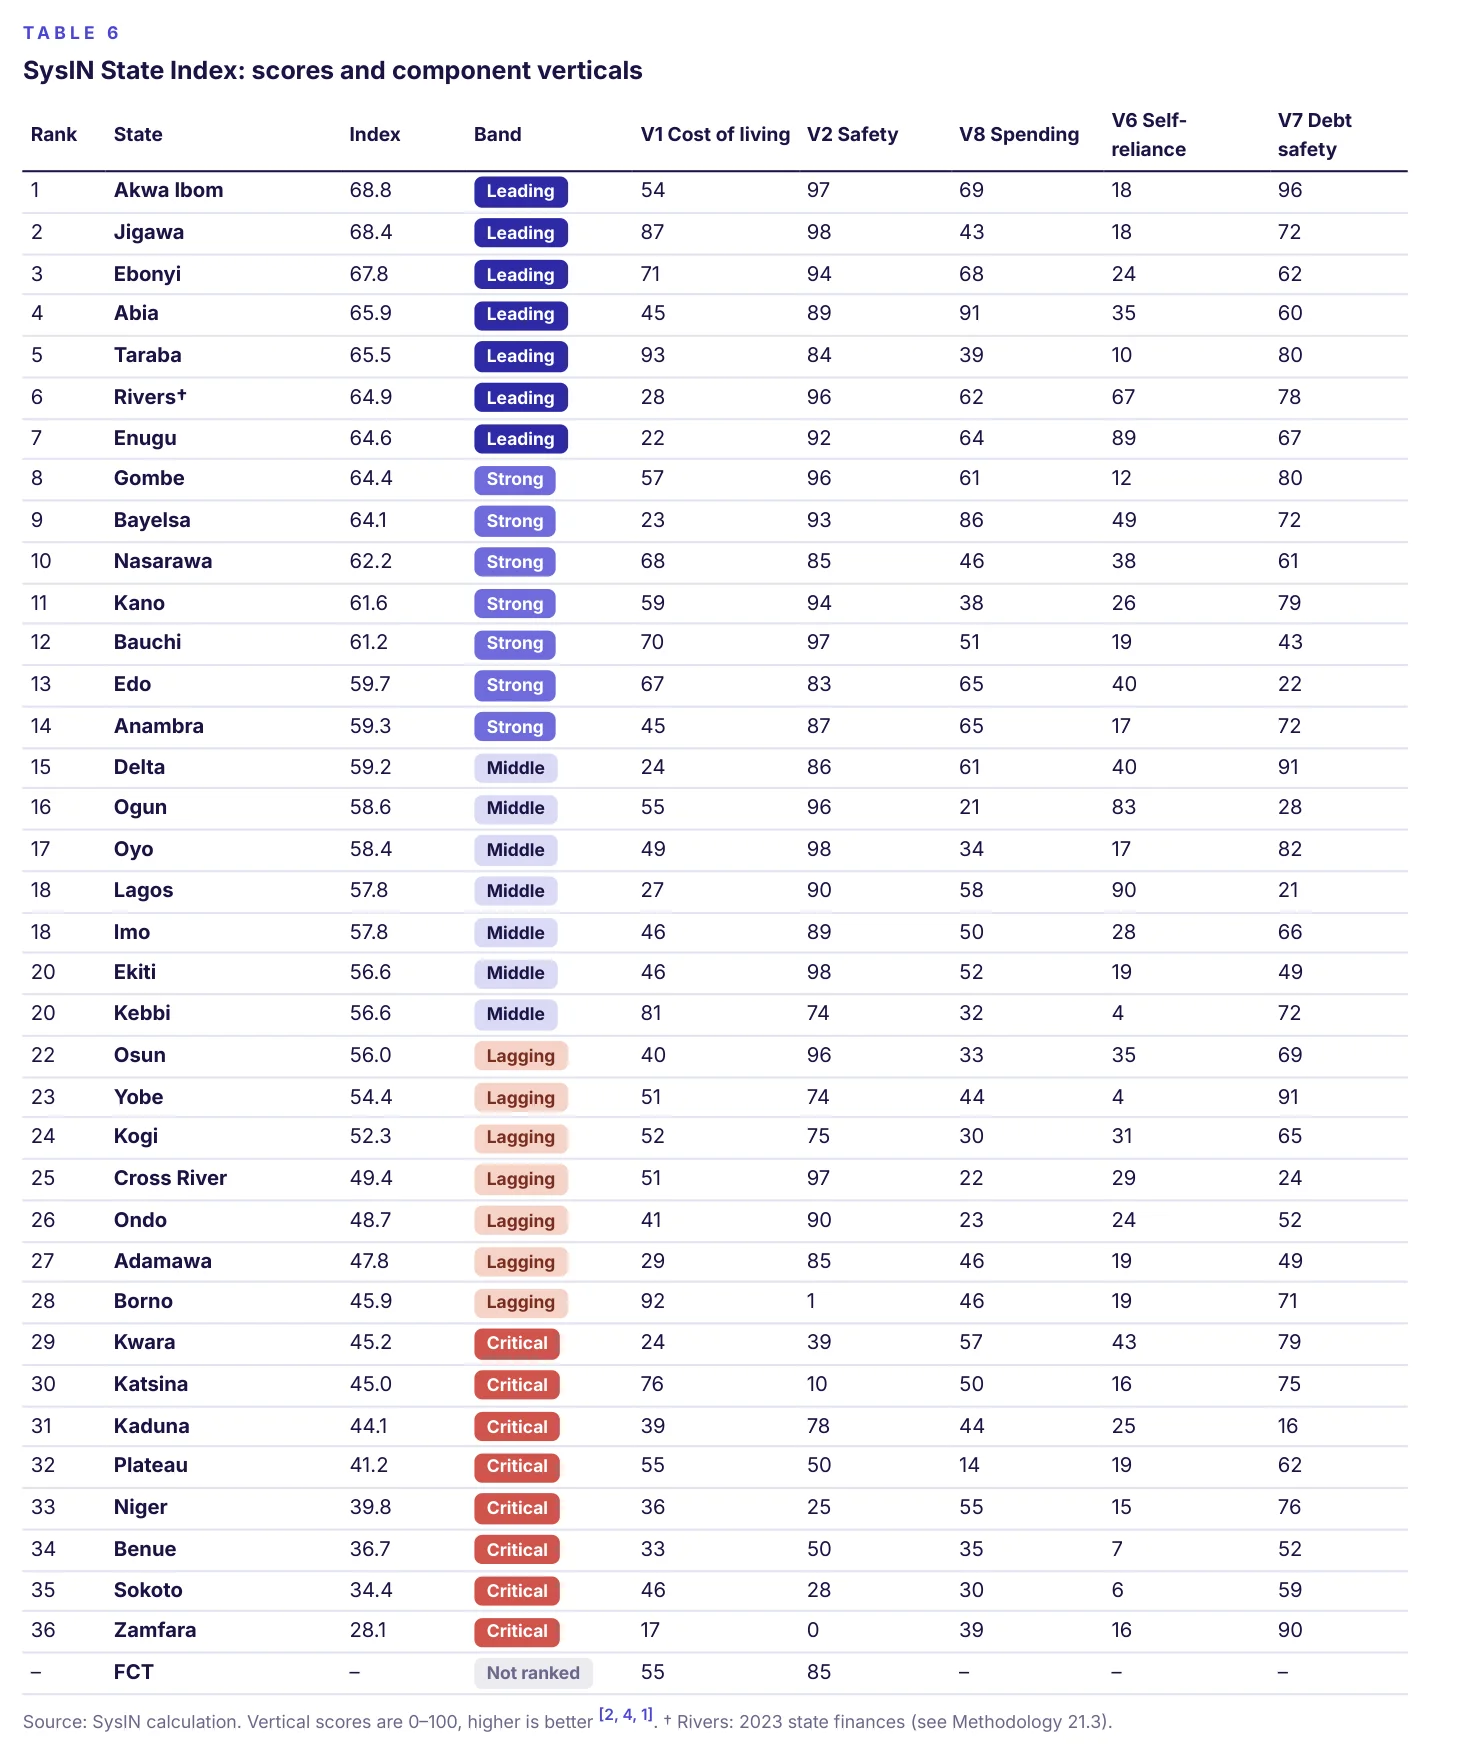
The headline index combines the five verticals with the freshest data. Half of its weight rests on outcomes residents experience directly — prices and safety — and half on how state governments raise, borrow and spend money.
The leading band mixes states from several regions: Akwa Ibom, Jigawa, Ebonyi, Abia, Taraba, Rivers and Enugu. Most combine relatively low conflict death rates with a high share of spending on capital projects; their inflation records vary, from among the lowest pressures (Taraba, Jigawa) to among the highest (Enugu). Jigawa, for example, combines low inflation with one of the lowest conflict death rates in the country, while Taraba pairs the least inflation pressure with a falling death rate.
The critical band is dominated by states at the centre of Nigeria's security crisis: Kwara, Katsina, Kaduna, Plateau, Niger, Benue, Sokoto and Zamfara. Their fiscal scores are often middling, but high conflict death rates pull them to the bottom.
Lagos ranks 18th. It leads on fiscal self-reliance but is held back by above-average inflation and the secondweakest debt-safety score, reflecting its large foreigncurrency borrowing.
| Rank | State | Index | Band | V1 Cost of living | V2 Safety | V8 Spending | V6 Self-reliance | V7 Debt safety |
|---|---|---|---|---|---|---|---|---|
| 1 | Akwa Ibom | 68.8 | Leading | 54 | 97 | 69 | 18 | 96 |
| 2 | Jigawa | 68.4 | Leading | 87 | 98 | 43 | 18 | 72 |
| 3 | Ebonyi | 67.8 | Leading | 71 | 94 | 68 | 24 | 62 |
| 4 | Abia | 65.9 | Leading | 45 | 89 | 91 | 35 | 60 |
| 5 | Taraba | 65.5 | Leading | 93 | 84 | 39 | 10 | 80 |
| 6 | Rivers† | 64.9 | Leading | 28 | 96 | 62 | 67 | 78 |
| 7 | Enugu | 64.6 | Leading | 22 | 92 | 64 | 89 | 67 |
| 8 | Gombe | 64.4 | Strong | 57 | 96 | 61 | 12 | 80 |
| 9 | Bayelsa | 64.1 | Strong | 23 | 93 | 86 | 49 | 72 |
| 10 | Nasarawa | 62.2 | Strong | 68 | 85 | 46 | 38 | 61 |
| 11 | Kano | 61.6 | Strong | 59 | 94 | 38 | 26 | 79 |
| 12 | Bauchi | 61.2 | Strong | 70 | 97 | 51 | 19 | 43 |
| 13 | Edo | 59.7 | Strong | 67 | 83 | 65 | 40 | 22 |
| 14 | Anambra | 59.3 | Strong | 45 | 87 | 65 | 17 | 72 |
| 15 | Delta | 59.2 | Middle | 24 | 86 | 61 | 40 | 91 |
| 16 | Ogun | 58.6 | Middle | 55 | 96 | 21 | 83 | 28 |
| 17 | Oyo | 58.4 | Middle | 49 | 98 | 34 | 17 | 82 |
| 18 | Lagos | 57.8 | Middle | 27 | 90 | 58 | 90 | 21 |
| 18 | Imo | 57.8 | Middle | 46 | 89 | 50 | 28 | 66 |
| 20 | Ekiti | 56.6 | Middle | 46 | 98 | 52 | 19 | 49 |
| 20 | Kebbi | 56.6 | Middle | 81 | 74 | 32 | 4 | 72 |
| 22 | Osun | 56.0 | Lagging | 40 | 96 | 33 | 35 | 69 |
| 23 | Yobe | 54.4 | Lagging | 51 | 74 | 44 | 4 | 91 |
| 24 | Kogi | 52.3 | Lagging | 52 | 75 | 30 | 31 | 65 |
| 25 | Cross River | 49.4 | Lagging | 51 | 97 | 22 | 29 | 24 |
| 26 | Ondo | 48.7 | Lagging | 41 | 90 | 23 | 24 | 52 |
| 27 | Adamawa | 47.8 | Lagging | 29 | 85 | 46 | 19 | 49 |
| 28 | Borno | 45.9 | Lagging | 92 | 1 | 46 | 19 | 71 |
| 29 | Kwara | 45.2 | Critical | 24 | 39 | 57 | 43 | 79 |
| 30 | Katsina | 45.0 | Critical | 76 | 10 | 50 | 16 | 75 |
| 31 | Kaduna | 44.1 | Critical | 39 | 78 | 44 | 25 | 16 |
| 32 | Plateau | 41.2 | Critical | 55 | 50 | 14 | 19 | 62 |
| 33 | Niger | 39.8 | Critical | 36 | 25 | 55 | 15 | 76 |
| 34 | Benue | 36.7 | Critical | 33 | 50 | 35 | 7 | 52 |
| 35 | Sokoto | 34.4 | Critical | 46 | 28 | 30 | 6 | 59 |
| 36 | Zamfara | 28.1 | Critical | 17 | 0 | 39 | 16 | 90 |
| – | FCT | – | Not ranked | 55 | 85 | – | – | – |
Cost of Living Pressure
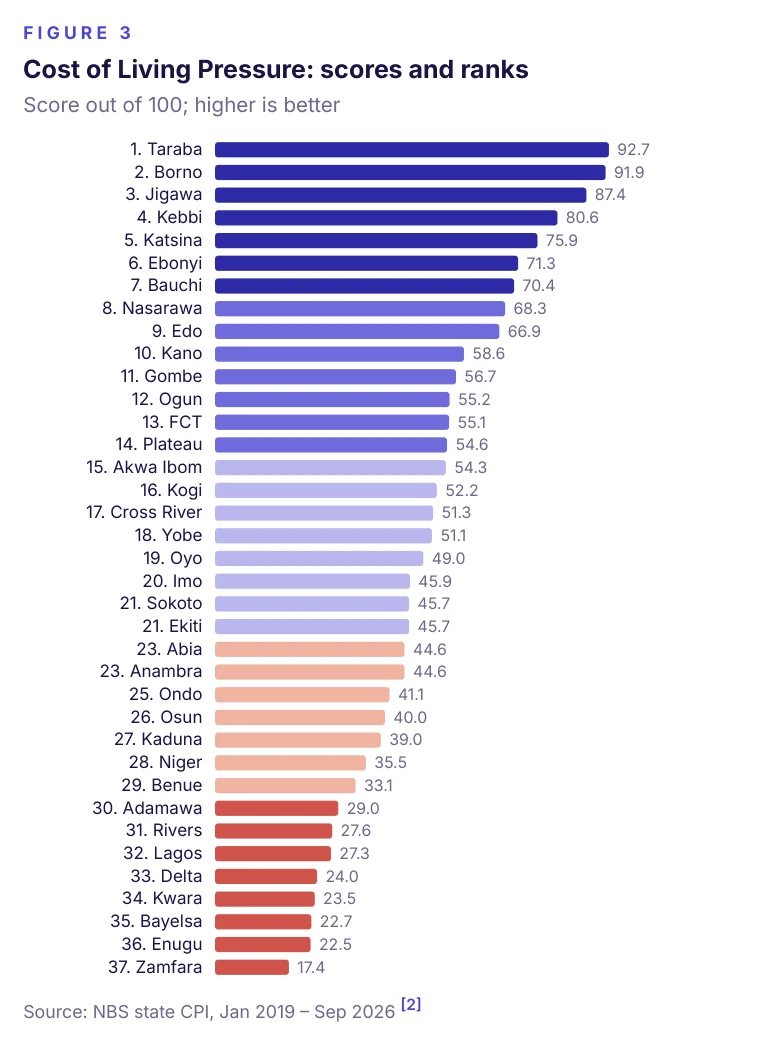
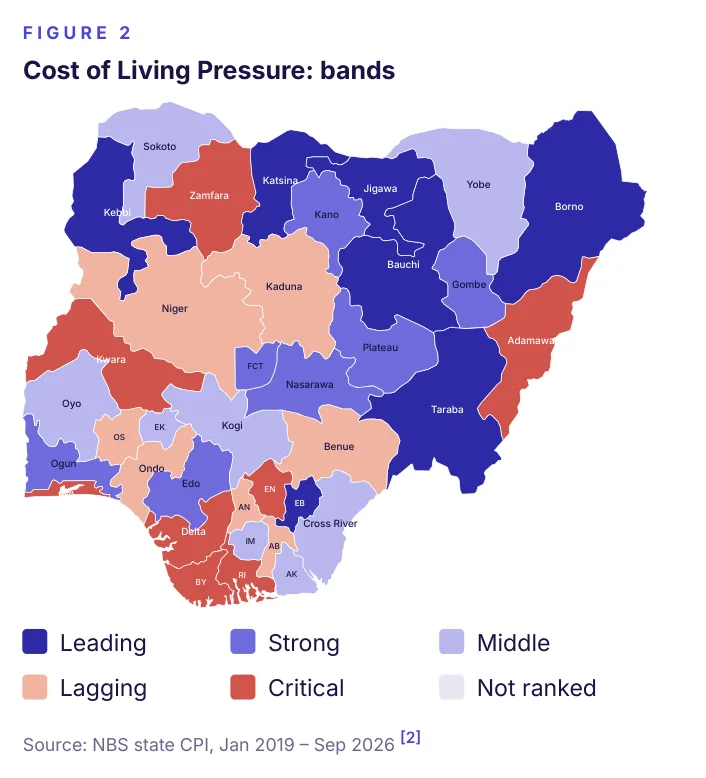
Prices rose fastest over the past year in Zamfara, Yobe and Enugu, where headline inflation averaged 17.8% or more between October 2025 and September 2026 [2].
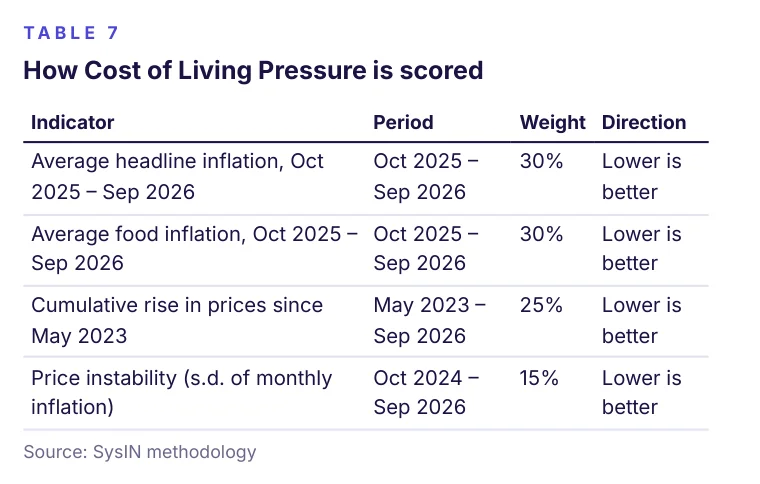
The vertical rewards low recent inflation for all items and for food, a small cumulative price rise since May 2023, and stable month-to-month prices. Because NBS advises against comparing state price levels, all four indicators use rates of change.
| Rank | State | Score out of 100; higher is better |
|---|---|---|
| 1 | Taraba | 92.7 |
| 2 | Borno | 91.9 |
| 3 | Jigawa | 87.4 |
| 4 | Kebbi | 80.6 |
| 5 | Katsina | 75.9 |
| 6 | Ebonyi | 71.3 |
| 7 | Bauchi | 70.4 |
| 8 | Nasarawa | 68.3 |
| 9 | Edo | 66.9 |
| 10 | Kano | 58.6 |
| 11 | Gombe | 56.7 |
| 12 | Ogun | 55.2 |
| 13 | FCT | 55.1 |
| 14 | Plateau | 54.6 |
| 15 | Akwa Ibom | 54.3 |
| 16 | Kogi | 52.2 |
| 17 | Cross River | 51.3 |
| 18 | Yobe | 51.1 |
| 19 | Oyo | 49.0 |
| 20 | Imo | 45.9 |
| 21 | Sokoto | 45.7 |
| 21 | Ekiti | 45.7 |
| 23 | Abia | 44.6 |
| 23 | Anambra | 44.6 |
| 25 | Ondo | 41.1 |
| 26 | Osun | 40.0 |
| 27 | Kaduna | 39.0 |
| 28 | Niger | 35.5 |
| 29 | Benue | 33.1 |
| 30 | Adamawa | 29.0 |
| 31 | Rivers | 27.6 |
| 32 | Lagos | 27.3 |
| 33 | Delta | 24.0 |
| 34 | Kwara | 23.5 |
| 35 | Bayelsa | 22.7 |
| 36 | Enugu | 22.5 |
| 37 | Zamfara | 17.4 |
| Indicator | Period | Weight | Direction |
|---|---|---|---|
| Average headline inflation, Oct 2025 – Sep 2026 | Oct 2025 – Sep 2026 | 30% | Lower is better |
| Average food inflation, Oct 2025 – Sep 2026 | Oct 2025 – Sep 2026 | 30% | Lower is better |
| Cumulative rise in prices since May 2023 | May 2023 – Sep 2026 | 25% | Lower is better |
| Price instability (s.d. of monthly inflation) | Oct 2024 – Sep 2026 | 15% | Lower is better |
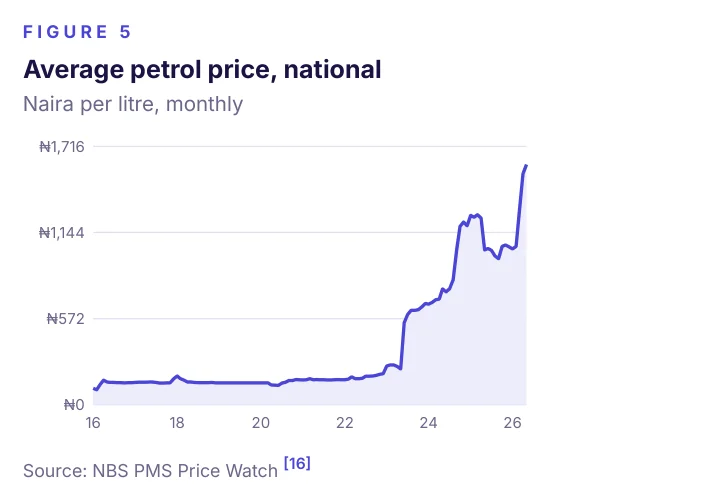
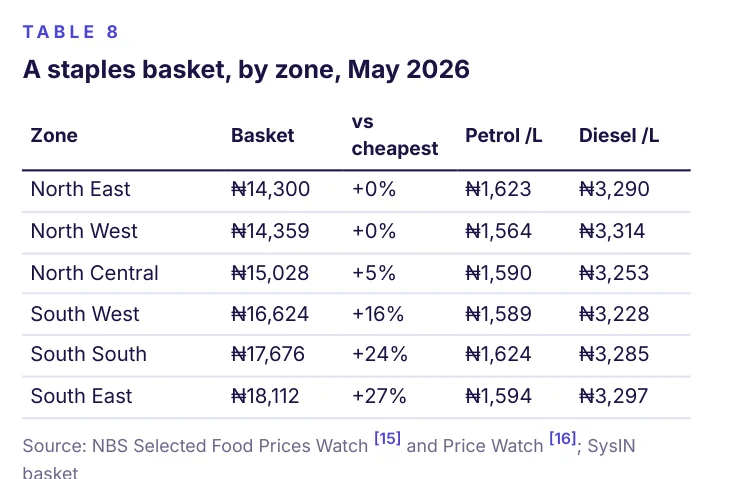
| Zone | Basket | vs cheapest | Petrol /L | Diesel /L |
|---|---|---|---|---|
| North East | ₦14,300 | +0% | ₦1,623 | ₦3,290 |
| North West | ₦14,359 | +0% | ₦1,564 | ₦3,314 |
| North Central | ₦15,028 | +5% | ₦1,590 | ₦3,253 |
| South West | ₦16,624 | +16% | ₦1,589 | ₦3,228 |
| South South | ₦17,676 | +24% | ₦1,624 | ₦3,285 |
| South East | ₦18,112 | +27% | ₦1,594 | ₦3,297 |
Safety & Security
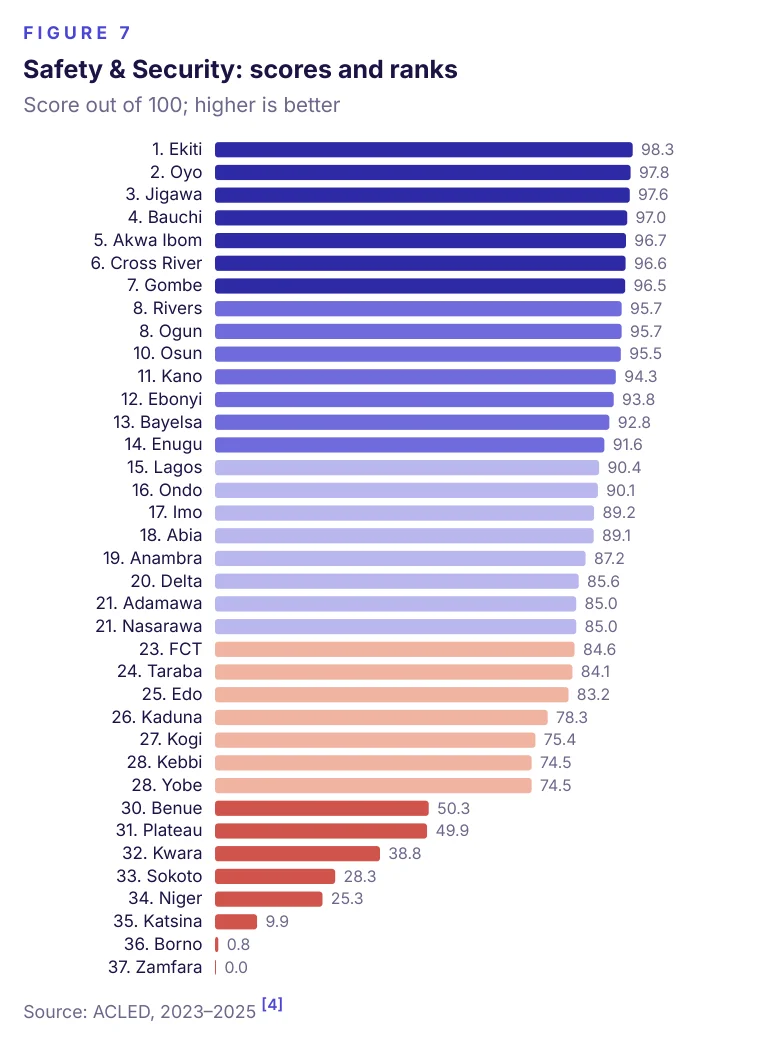
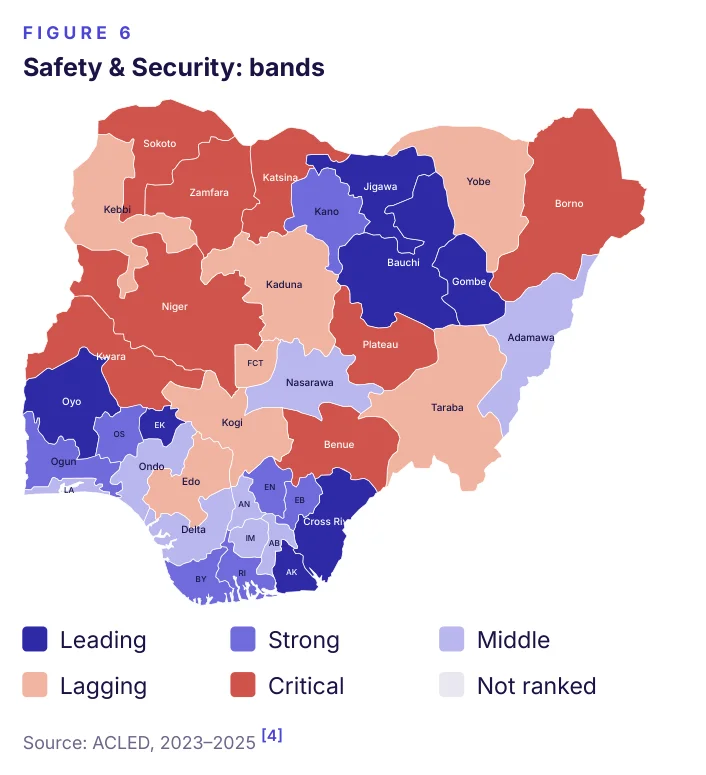
The safest states in 2025 were Ekiti, Oyo and Jigawa.
At the other end, Katsina, Borno and Zamfara score lowest: each recorded violence in every week of 2025, and death rates far above the national median [4].
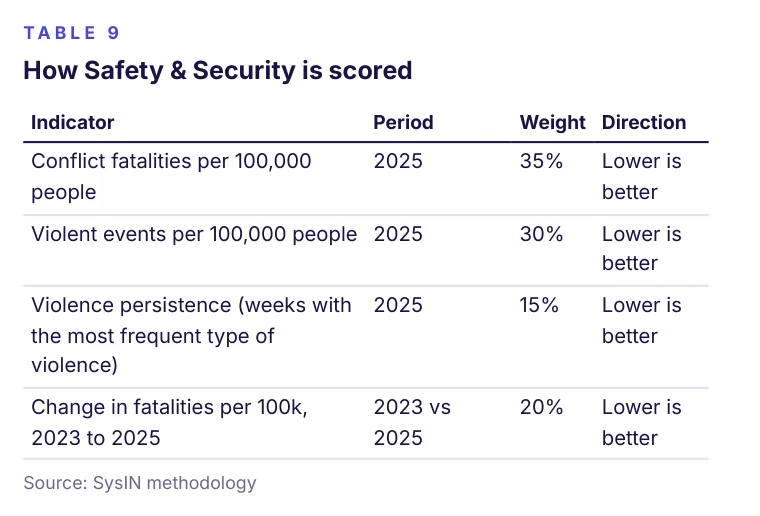
The vertical uses conflict deaths and violent events per 100,000 people, the persistence of violence through the year, and the change in the death rate since 2023, so that improving states are rewarded.
| Rank | State/FCT | Score out of 100; higher is better |
|---|---|---|
| 1 | Ekiti | 98.3 |
| 2 | Oyo | 97.8 |
| 3 | Jigawa | 97.6 |
| 4 | Bauchi | 97.0 |
| 5 | Akwa Ibom | 96.7 |
| 6 | Cross River | 96.6 |
| 7 | Gombe | 96.5 |
| 8 | Rivers | 95.7 |
| 8 | Ogun | 95.7 |
| 10 | Osun | 95.5 |
| 11 | Kano | 94.3 |
| 12 | Ebonyi | 93.8 |
| 13 | Bayelsa | 92.8 |
| 14 | Enugu | 91.6 |
| 15 | Lagos | 90.4 |
| 16 | Ondo | 90.1 |
| 17 | Imo | 89.2 |
| 18 | Abia | 89.1 |
| 19 | Anambra | 87.2 |
| 20 | Delta | 85.6 |
| 21 | Adamawa | 85.0 |
| 21 | Nasarawa | 85.0 |
| 23 | FCT | 84.6 |
| 24 | Taraba | 84.1 |
| 25 | Edo | 83.2 |
| 26 | Kaduna | 78.3 |
| 27 | Kogi | 75.4 |
| 28 | Kebbi | 74.5 |
| 28 | Yobe | 74.5 |
| 30 | Benue | 50.3 |
| 31 | Plateau | 49.9 |
| 32 | Kwara | 38.8 |
| 33 | Sokoto | 28.3 |
| 34 | Niger | 25.3 |
| 35 | Katsina | 9.9 |
| 36 | Borno | 0.8 |
| 37 | Zamfara | 0.0 |
| Indicator | Period | Weight | Direction |
|---|---|---|---|
| Conflict fatalities per 100,000 people | 2025 | 35% | Lower is better |
| Violent events per 100,000 people | 2025 | 30% | Lower is better |
| Violence persistence (weeks with the most frequent type of violence) | 2025 | 15% | Lower is better |
| Change in fatalities per 100k, 2023 to 2025 | 2023 vs 2025 | 20% | Lower is better |
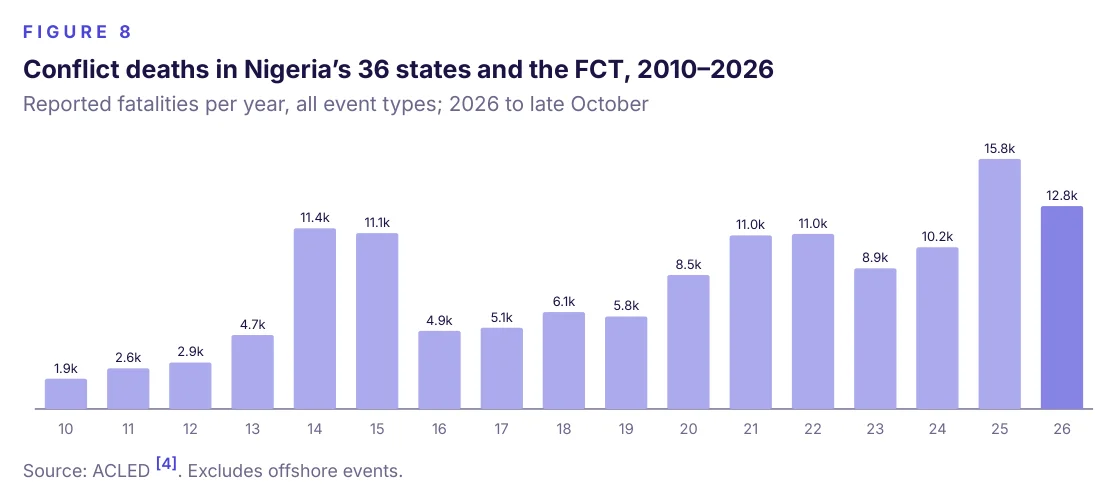
| Year (2010–2026; labels as displayed) | Reported fatalities per year, all event types; 2026 to late October; Excludes offshore events. |
|---|---|
| 10 | 1.9k |
| 11 | 2.6k |
| 12 | 2.9k |
| 13 | 4.7k |
| 14 | 11.4k |
| 15 | 11.1k |
| 16 | 4.9k |
| 17 | 5.1k |
| 18 | 6.1k |
| 19 | 5.8k |
| 20 | 8.5k |
| 21 | 11.0k |
| 22 | 11.0k |
| 23 | 8.9k |
| 24 | 10.2k |
| 25 | 15.8k |
| 26 | 12.8k |
Kidnapping Risk
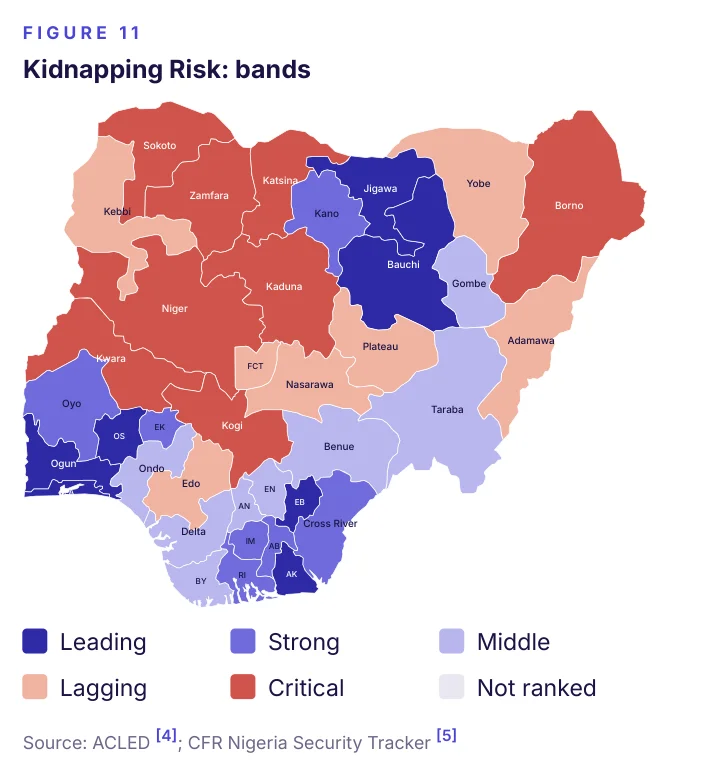
Relative to population, kidnapping is most common in Zamfara, Katsina and Kwara. Historically, the Nigeria Security Tracker recorded 18,954 persons kidnapped in the 36 states and the FCT between 2011 and mid-2023 (excluding incidents with an unknown location), the largest numbers in Kaduna, Zamfara and Niger [5].
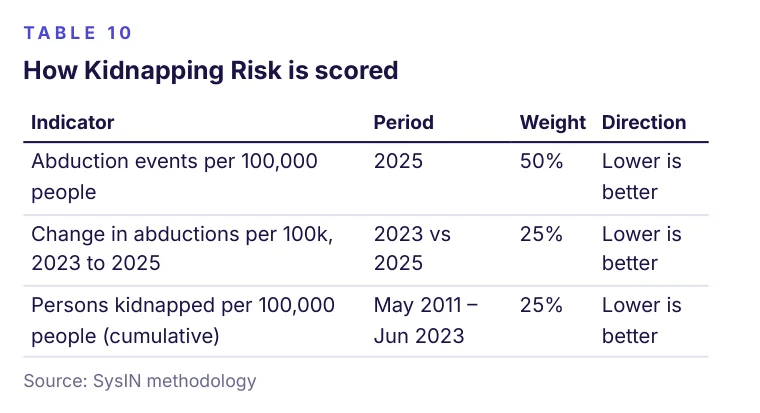
The vertical combines the current abduction rate (half the weight), its change since 2023 and the long-run kidnapping record.
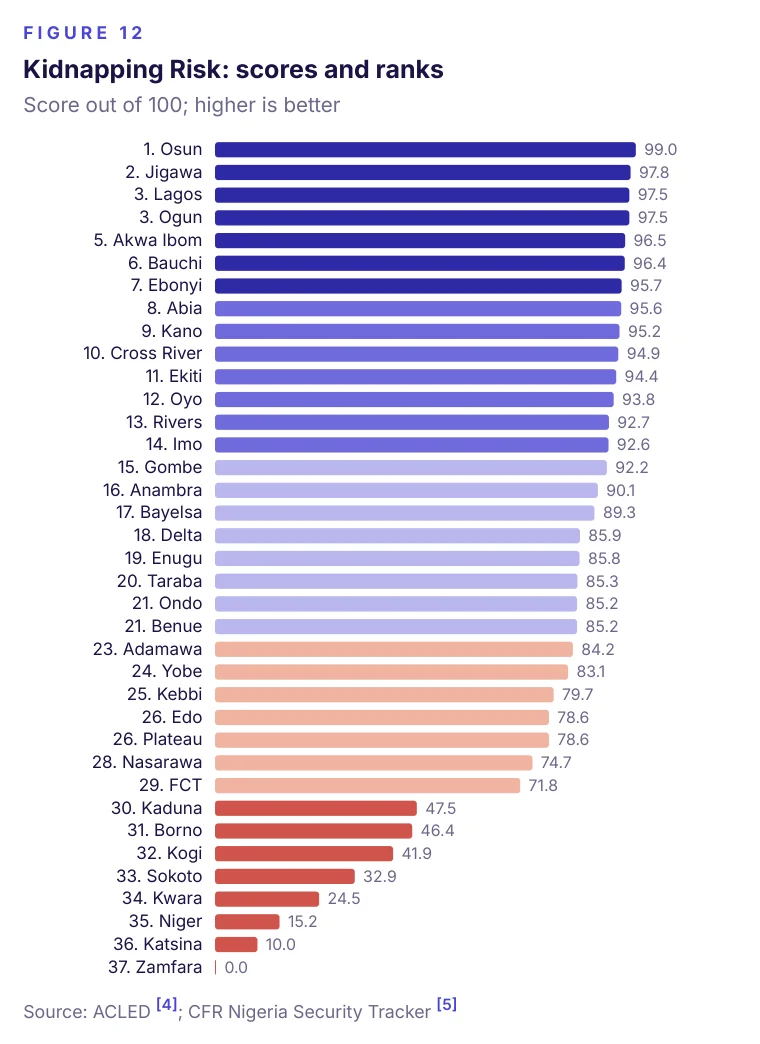
| Rank | State | Kidnapping Risk: Score out of 100; higher is better |
|---|---|---|
| 1 | Osun | 99.0 |
| 2 | Jigawa | 97.8 |
| 3 | Lagos | 97.5 |
| 3 | Ogun | 97.5 |
| 5 | Akwa Ibom | 96.5 |
| 6 | Bauchi | 96.4 |
| 7 | Ebonyi | 95.7 |
| 8 | Abia | 95.6 |
| 9 | Kano | 95.2 |
| 10 | Cross River | 94.9 |
| 11 | Ekiti | 94.4 |
| 12 | Oyo | 93.8 |
| 13 | Rivers | 92.7 |
| 14 | Imo | 92.6 |
| 15 | Gombe | 92.2 |
| 16 | Anambra | 90.1 |
| 17 | Bayelsa | 89.3 |
| 18 | Delta | 85.9 |
| 19 | Enugu | 85.8 |
| 20 | Taraba | 85.3 |
| 21 | Ondo | 85.2 |
| 21 | Benue | 85.2 |
| 23 | Adamawa | 84.2 |
| 24 | Yobe | 83.1 |
| 25 | Kebbi | 79.7 |
| 26 | Edo | 78.6 |
| 26 | Plateau | 78.6 |
| 28 | Nasarawa | 74.7 |
| 29 | FCT | 71.8 |
| 30 | Kaduna | 47.5 |
| 31 | Borno | 46.4 |
| 32 | Kogi | 41.9 |
| 33 | Sokoto | 32.9 |
| 34 | Kwara | 24.5 |
| 35 | Niger | 15.2 |
| 36 | Katsina | 10.0 |
| 37 | Zamfara | 0.0 |
| Indicator | Period | Weight | Direction |
|---|---|---|---|
| Abduction events per 100,000 people | 2025 | 50% | Lower is better |
| Change in abductions per 100k, 2023 to 2025 | 2023 vs 2025 | 25% | Lower is better |
| Persons kidnapped per 100,000 people (cumulative) | May 2011 – Jun 2023 | 25% | Lower is better |
Civilian Protection
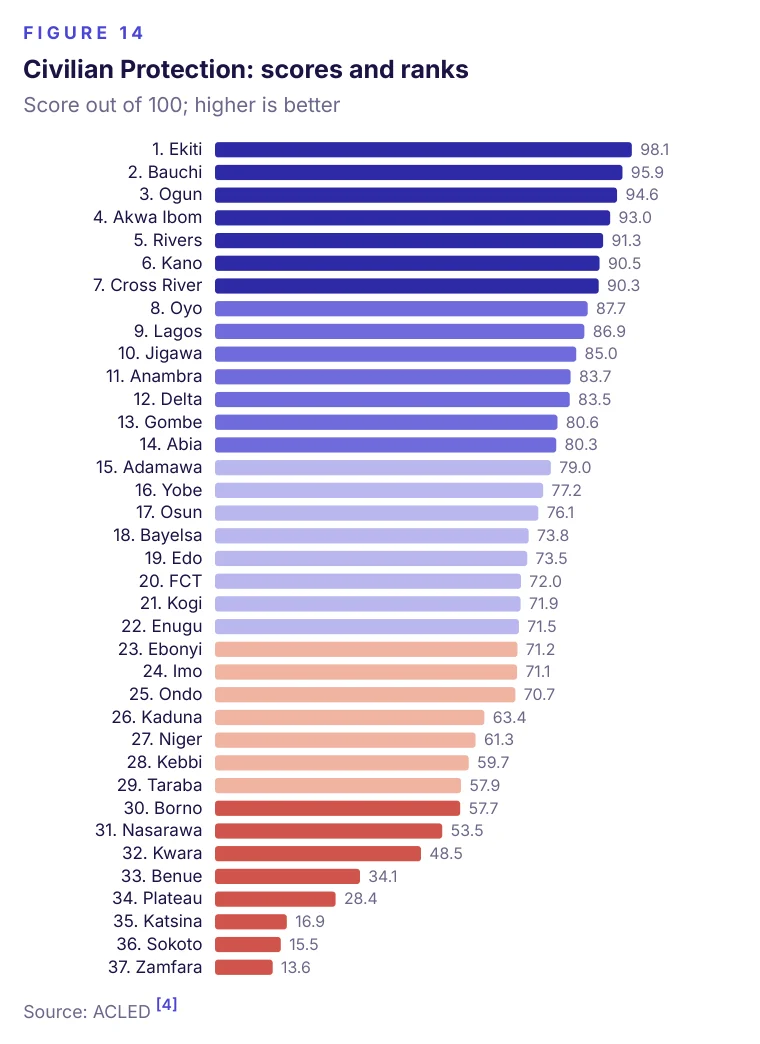
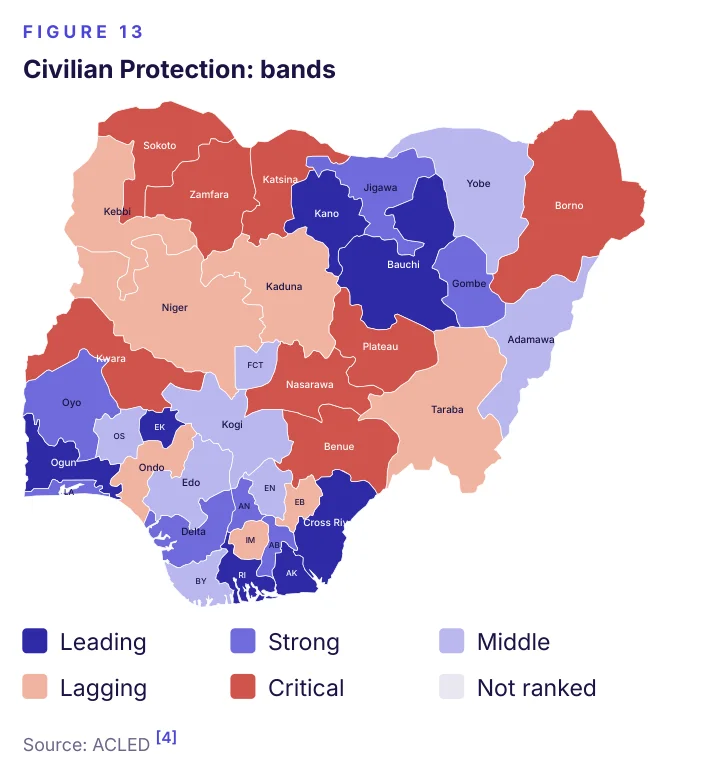
Violence aimed directly at civilians — attacks, abductions and sexual violence — accounted for 59% of violent events in 2025 [4]. Civilians face the greatest risk in Katsina, Sokoto and Zamfara; Ekiti, Bauchi and Ogun score best on Civilian Protection, which also weighs civilian deaths and the civilian share of fatalities.
| Rank | State | Civilian Protection: Score out of 100; higher is better |
|---|---|---|
| 1 | Ekiti | 98.1 |
| 2 | Bauchi | 95.9 |
| 3 | Ogun | 94.6 |
| 4 | Akwa Ibom | 93.0 |
| 5 | Rivers | 91.3 |
| 6 | Kano | 90.5 |
| 7 | Cross River | 90.3 |
| 8 | Oyo | 87.7 |
| 9 | Lagos | 86.9 |
| 10 | Jigawa | 85.0 |
| 11 | Anambra | 83.7 |
| 12 | Delta | 83.5 |
| 13 | Gombe | 80.6 |
| 14 | Abia | 80.3 |
| 15 | Adamawa | 79.0 |
| 16 | Yobe | 77.2 |
| 17 | Osun | 76.1 |
| 18 | Bayelsa | 73.8 |
| 19 | Edo | 73.5 |
| 20 | FCT | 72.0 |
| 21 | Kogi | 71.9 |
| 22 | Enugu | 71.5 |
| 23 | Ebonyi | 71.2 |
| 24 | Imo | 71.1 |
| 25 | Ondo | 70.7 |
| 26 | Kaduna | 63.4 |
| 27 | Niger | 61.3 |
| 28 | Kebbi | 59.7 |
| 29 | Taraba | 57.9 |
| 30 | Borno | 57.7 |
| 31 | Nasarawa | 53.5 |
| 32 | Kwara | 48.5 |
| 33 | Benue | 34.1 |
| 34 | Plateau | 28.4 |
| 35 | Katsina | 16.9 |
| 36 | Sokoto | 15.5 |
| 37 | Zamfara | 13.6 |
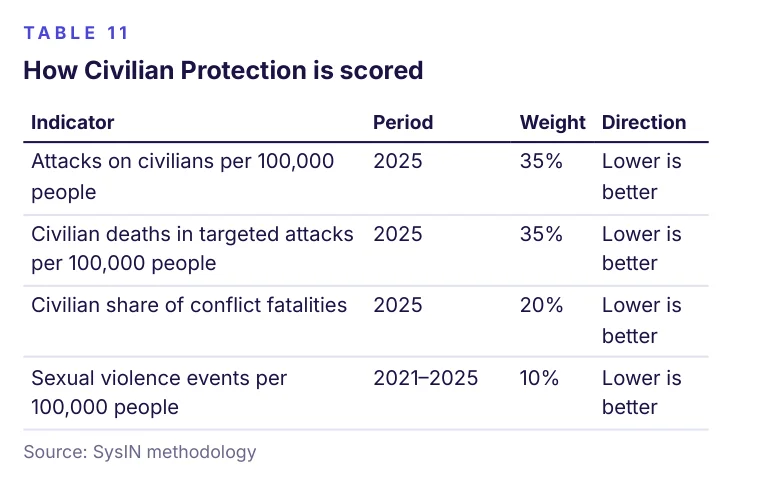
| Indicator | Period | Weight | Direction |
|---|---|---|---|
| Attacks on civilians per 100,000 people | 2025 | 35% | Lower is better |
| Civilian deaths in targeted attacks per 100,000 people | 2025 | 35% | Lower is better |
| Civilian share of conflict fatalities | 2025 | 20% | Lower is better |
| Sexual violence events per 100,000 people | 2021–2025 | 10% | Lower is better |
FAAC Windfall
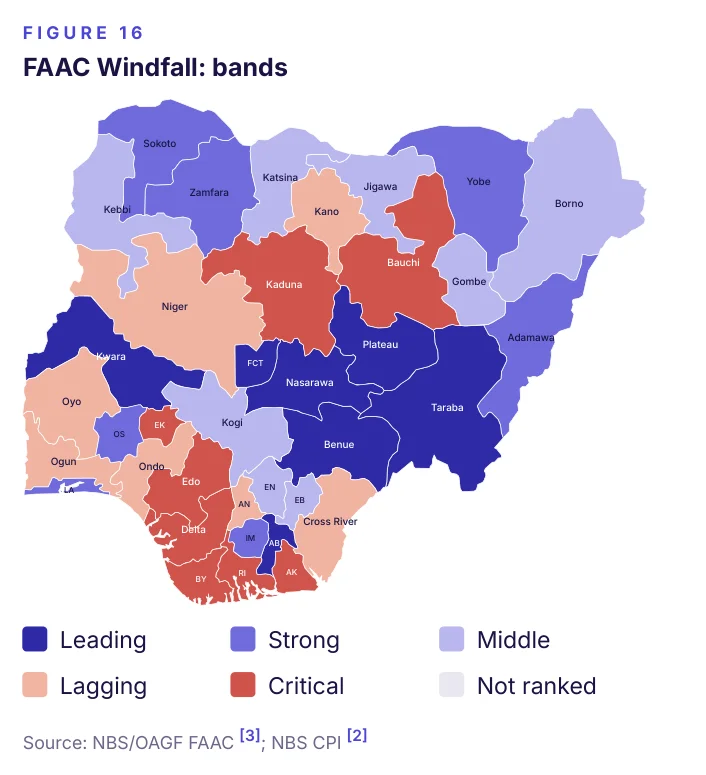
Net transfers rose from an average of ₦305 billion a month (June 2022 – May 2023) to ₦793 billion (August 2025 – July 2026) [3]. After adjusting for each state's inflation, the largest real gains were in Lagos, Plateau and Osun, and Taraba, Nasarawa and Kwara score highest on this vertical. Akwa Ibom, Delta and Rivers — where the 13% derivation share paid to oil-producing states [18] had already lifted receipts — received less in real terms.
The vertical measures what states received, not how they used it; that question is addressed by the Value for the Windfall composite.
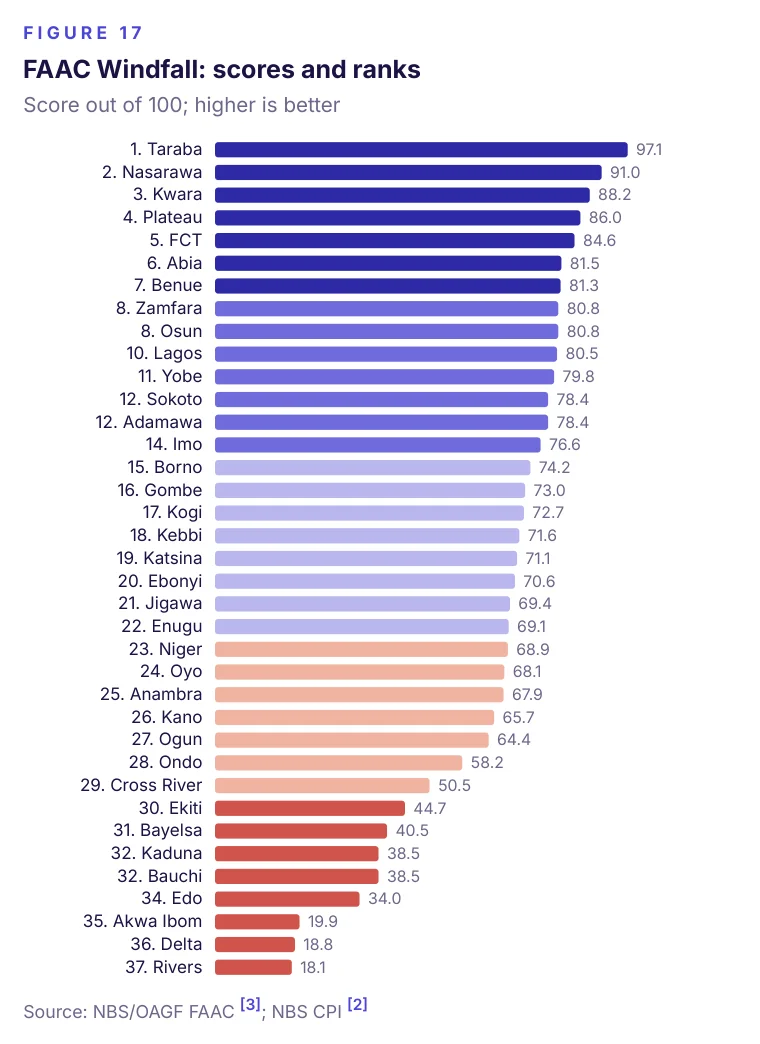
| Rank | State / FCT | Score out of 100; higher is better |
|---|---|---|
| 1 | Taraba | 97.1 |
| 2 | Nasarawa | 91.0 |
| 3 | Kwara | 88.2 |
| 4 | Plateau | 86.0 |
| 5 | FCT | 84.6 |
| 6 | Abia | 81.5 |
| 7 | Benue | 81.3 |
| 8 | Zamfara | 80.8 |
| 8 | Osun | 80.8 |
| 10 | Lagos | 80.5 |
| 11 | Yobe | 79.8 |
| 12 | Sokoto | 78.4 |
| 12 | Adamawa | 78.4 |
| 14 | Imo | 76.6 |
| 15 | Borno | 74.2 |
| 16 | Gombe | 73.0 |
| 17 | Kogi | 72.7 |
| 18 | Kebbi | 71.6 |
| 19 | Katsina | 71.1 |
| 20 | Ebonyi | 70.6 |
| 21 | Jigawa | 69.4 |
| 22 | Enugu | 69.1 |
| 23 | Niger | 68.9 |
| 24 | Oyo | 68.1 |
| 25 | Anambra | 67.9 |
| 26 | Kano | 65.7 |
| 27 | Ogun | 64.4 |
| 28 | Ondo | 58.2 |
| 29 | Cross River | 50.5 |
| 30 | Ekiti | 44.7 |
| 31 | Bayelsa | 40.5 |
| 32 | Kaduna | 38.5 |
| 32 | Bauchi | 38.5 |
| 34 | Edo | 34.0 |
| 35 | Akwa Ibom | 19.9 |
| 36 | Delta | 18.8 |
| 37 | Rivers | 18.1 |
Fiscal Self-Reliance
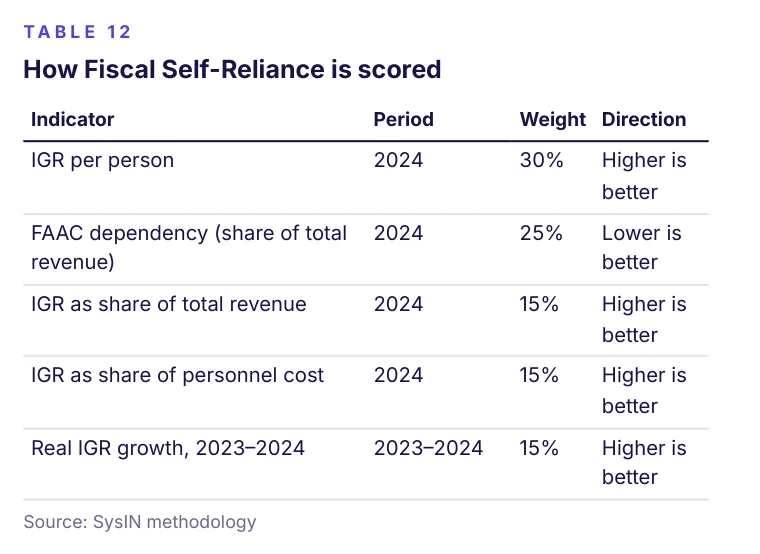
Lagos, Enugu and Ogun are the most fiscally selfreliant states. Lagos raised ₦77,869 per resident in 2024, against a median of ₦5,973 [1]. For Akwa Ibom, Sokoto and Taraba, FAAC transfers made up more than 88% of total revenue.
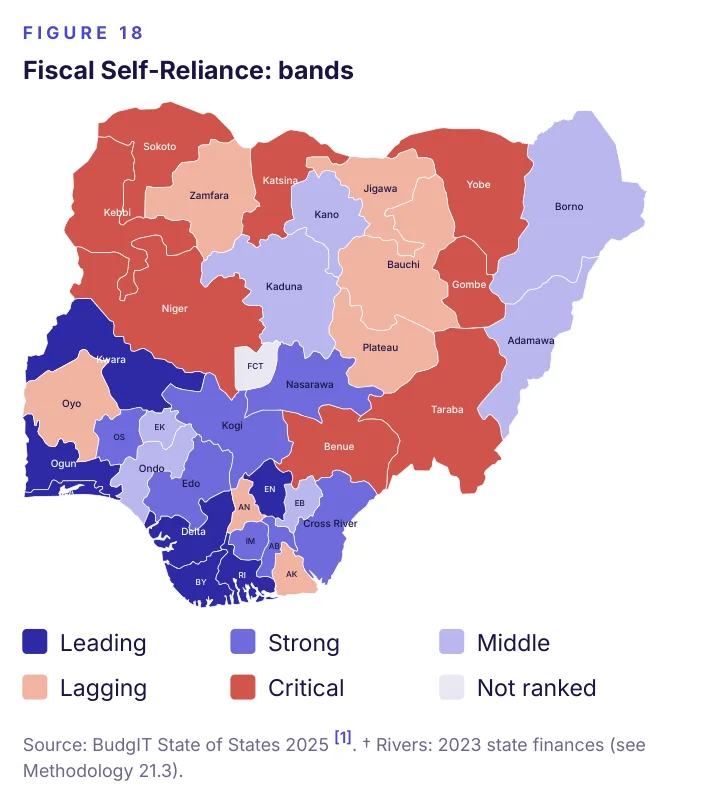
The vertical rewards high IGR per person, low dependence on FAAC, and IGR that covers a large share of salaries; real IGR growth adjusts for each state's inflation.
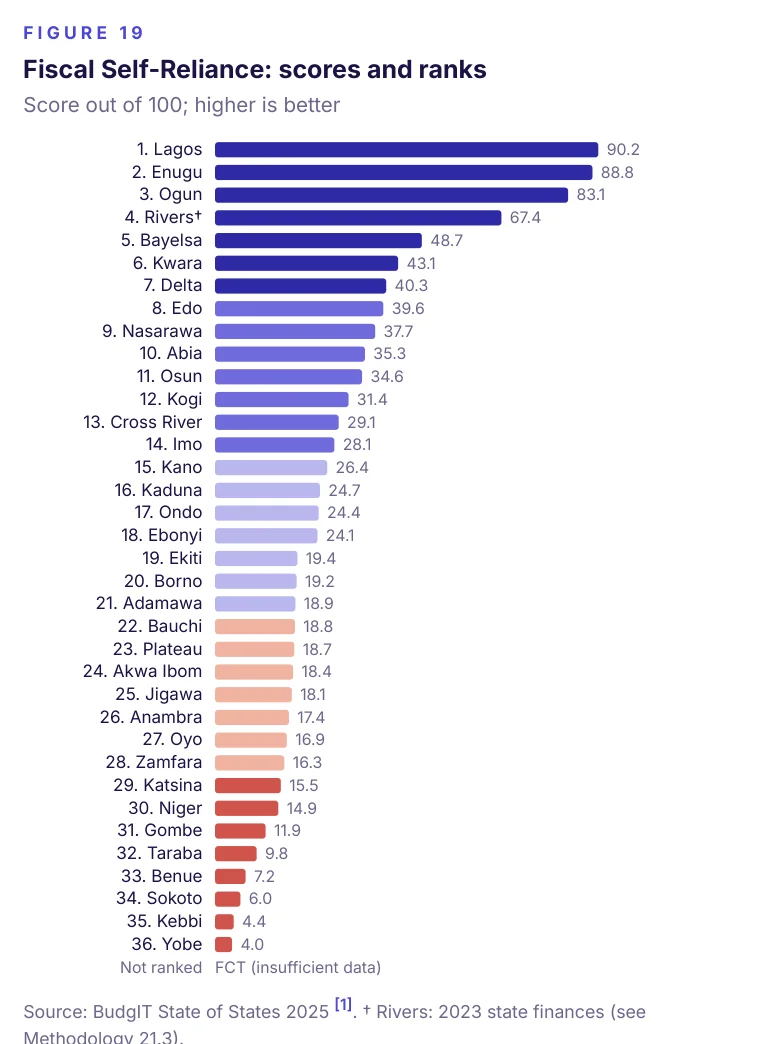
| Rank | State / FCT | Score out of 100; higher is better |
|---|---|---|
| 1 | Lagos | 90.2 |
| 2 | Enugu | 88.8 |
| 3 | Ogun | 83.1 |
| 4 | Rivers† | 67.4 |
| 5 | Bayelsa | 48.7 |
| 6 | Kwara | 43.1 |
| 7 | Delta | 40.3 |
| 8 | Edo | 39.6 |
| 9 | Nasarawa | 37.7 |
| 10 | Abia | 35.3 |
| 11 | Osun | 34.6 |
| 12 | Kogi | 31.4 |
| 13 | Cross River | 29.1 |
| 14 | Imo | 28.1 |
| 15 | Kano | 26.4 |
| 16 | Kaduna | 24.7 |
| 17 | Ondo | 24.4 |
| 18 | Ebonyi | 24.1 |
| 19 | Ekiti | 19.4 |
| 20 | Borno | 19.2 |
| 21 | Adamawa | 18.9 |
| 22 | Bauchi | 18.8 |
| 23 | Plateau | 18.7 |
| 24 | Akwa Ibom | 18.4 |
| 25 | Jigawa | 18.1 |
| 26 | Anambra | 17.4 |
| 27 | Oyo | 16.9 |
| 28 | Zamfara | 16.3 |
| 29 | Katsina | 15.5 |
| 30 | Niger | 14.9 |
| 31 | Gombe | 11.9 |
| 32 | Taraba | 9.8 |
| 33 | Benue | 7.2 |
| 34 | Sokoto | 6.0 |
| 35 | Kebbi | 4.4 |
| 36 | Yobe | 4.0 |
| Not ranked | FCT (insufficient data) |
| Indicator | Period | Weight | Direction |
|---|---|---|---|
| IGR per person | 2024 | 30% | Higher is better |
| FAAC dependency (share of total revenue) | 2024 | 25% | Lower is better |
| IGR as share of total revenue | 2024 | 15% | Higher is better |
| IGR as share of personnel cost | 2024 | 15% | Higher is better |
| Real IGR growth, 2023–2024 | 2023–2024 | 15% | Higher is better |
Debt Safety
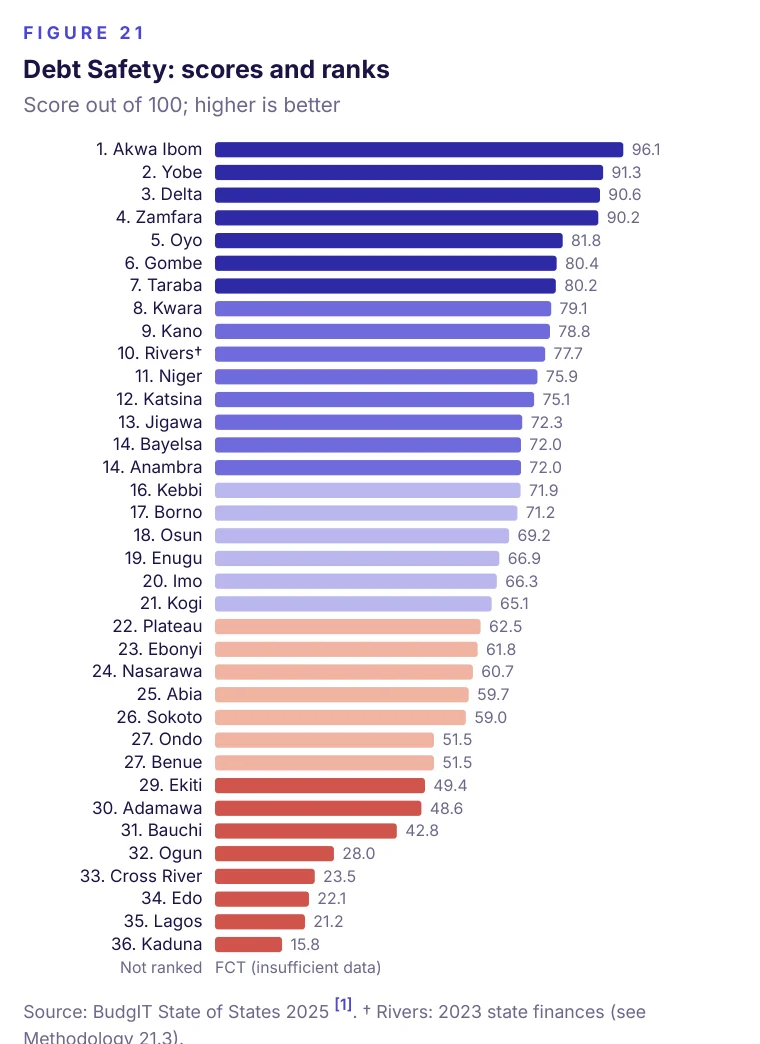
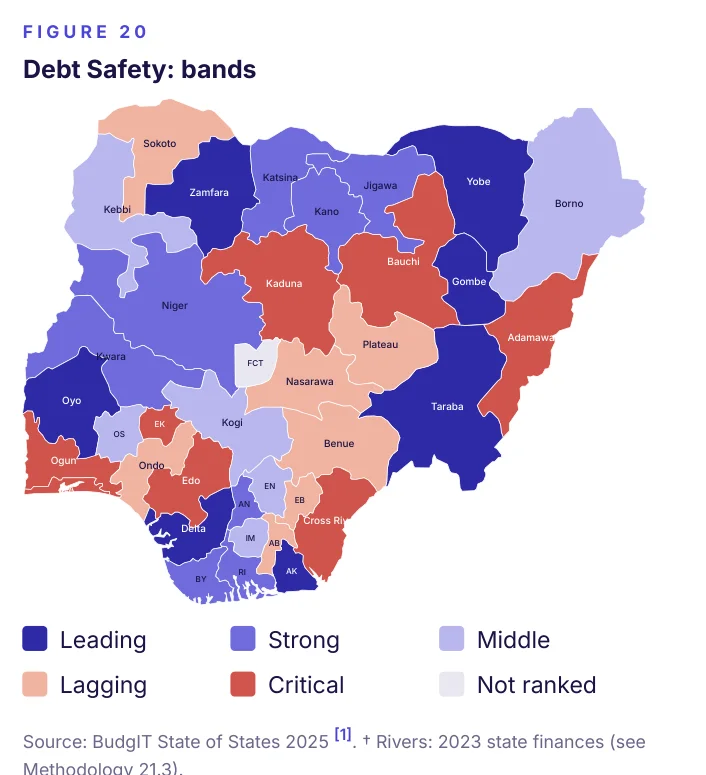
State debt totalled ₦10.6 trillion at the end of 2024 [1].
Akwa Ibom, Yobe and Delta are the safest borrowers; Edo, Lagos and Kaduna the most exposed. Kaduna's debt reached 199% of its 2024 revenue, close to the 200% debt-to-revenue threshold used in BudgIT's debt-sustainability analysis, and Benue spent 43% of revenue on debt service, above that analysis's 40% threshold [1].
24 states held more than half of their debt in foreign currency, which grows in naira terms whenever the exchange rate weakens.
| Indicator | Period | Weight | Direction |
|---|---|---|---|
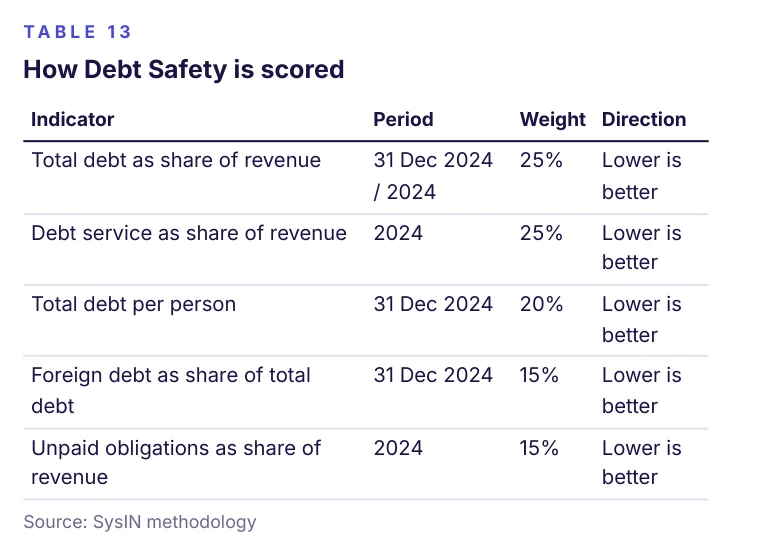
| Total debt as share of revenue | 31 Dec 2024 / 2024 | 25% | Lower is better |
| Debt service as share of revenue | 2024 | 25% | Lower is better |
| Total debt per person | 31 Dec 2024 | 20% | Lower is better |
| Foreign debt as share of total debt | 31 Dec 2024 | 15% | Lower is better |
| Unpaid obligations as share of revenue | 2024 | 15% | Lower is better |
Spending Priorities
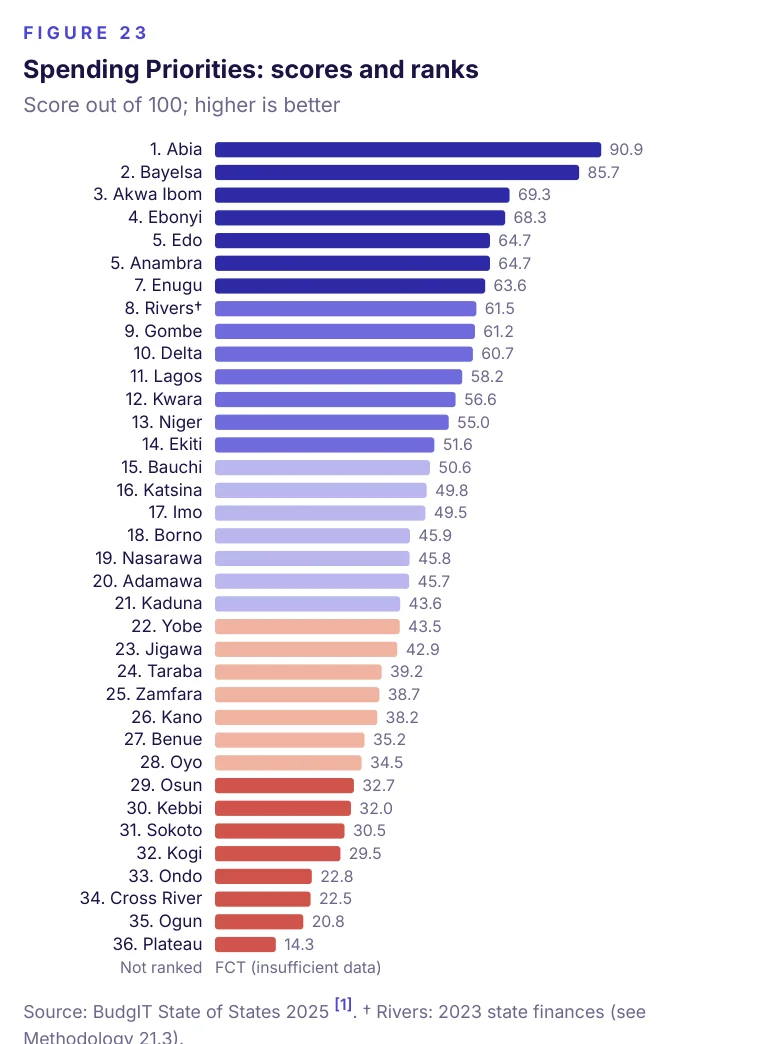
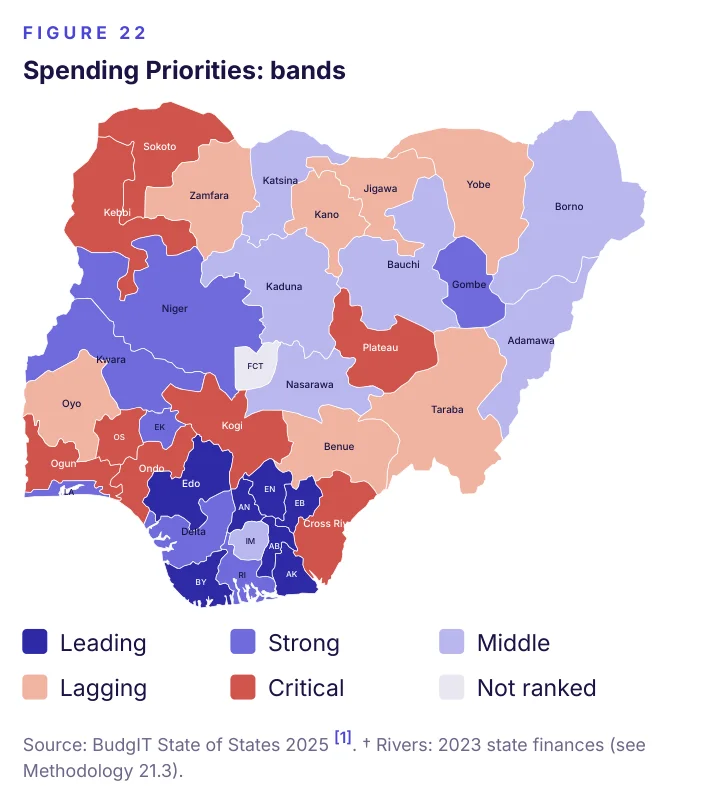
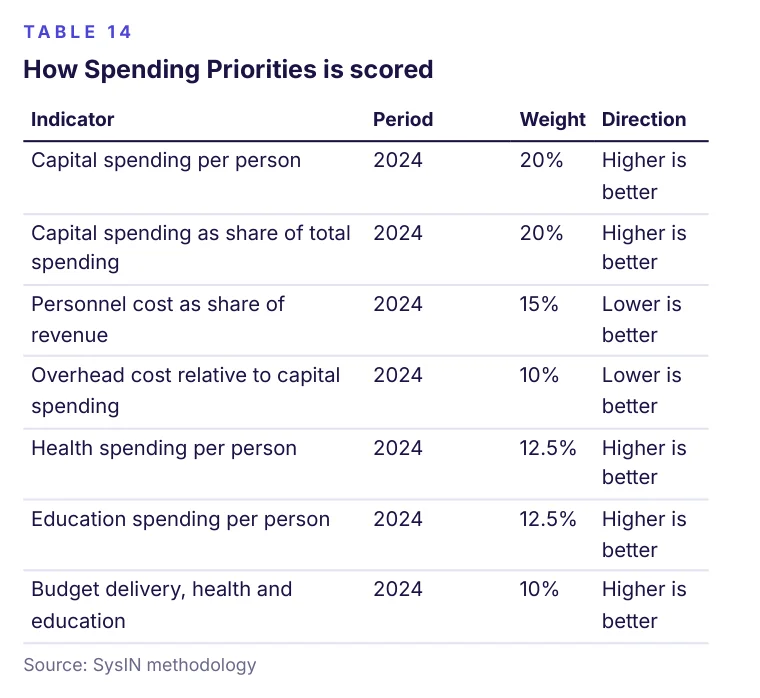
Abia, Bayelsa and Akwa Ibom score highest, combining a large share of spending on capital projects with comparatively high health and education spending per resident [1]; the largest capital shares were in Anambra, Ebonyi and Enugu. Cross River, Ogun and Plateau score lowest, each with less than a third of spending going to capital projects.
The median state spent ₦2,841 per resident on health and ₦5,951 on education in 2024.
| Indicator | Period | Weight | Direction |
|---|---|---|---|
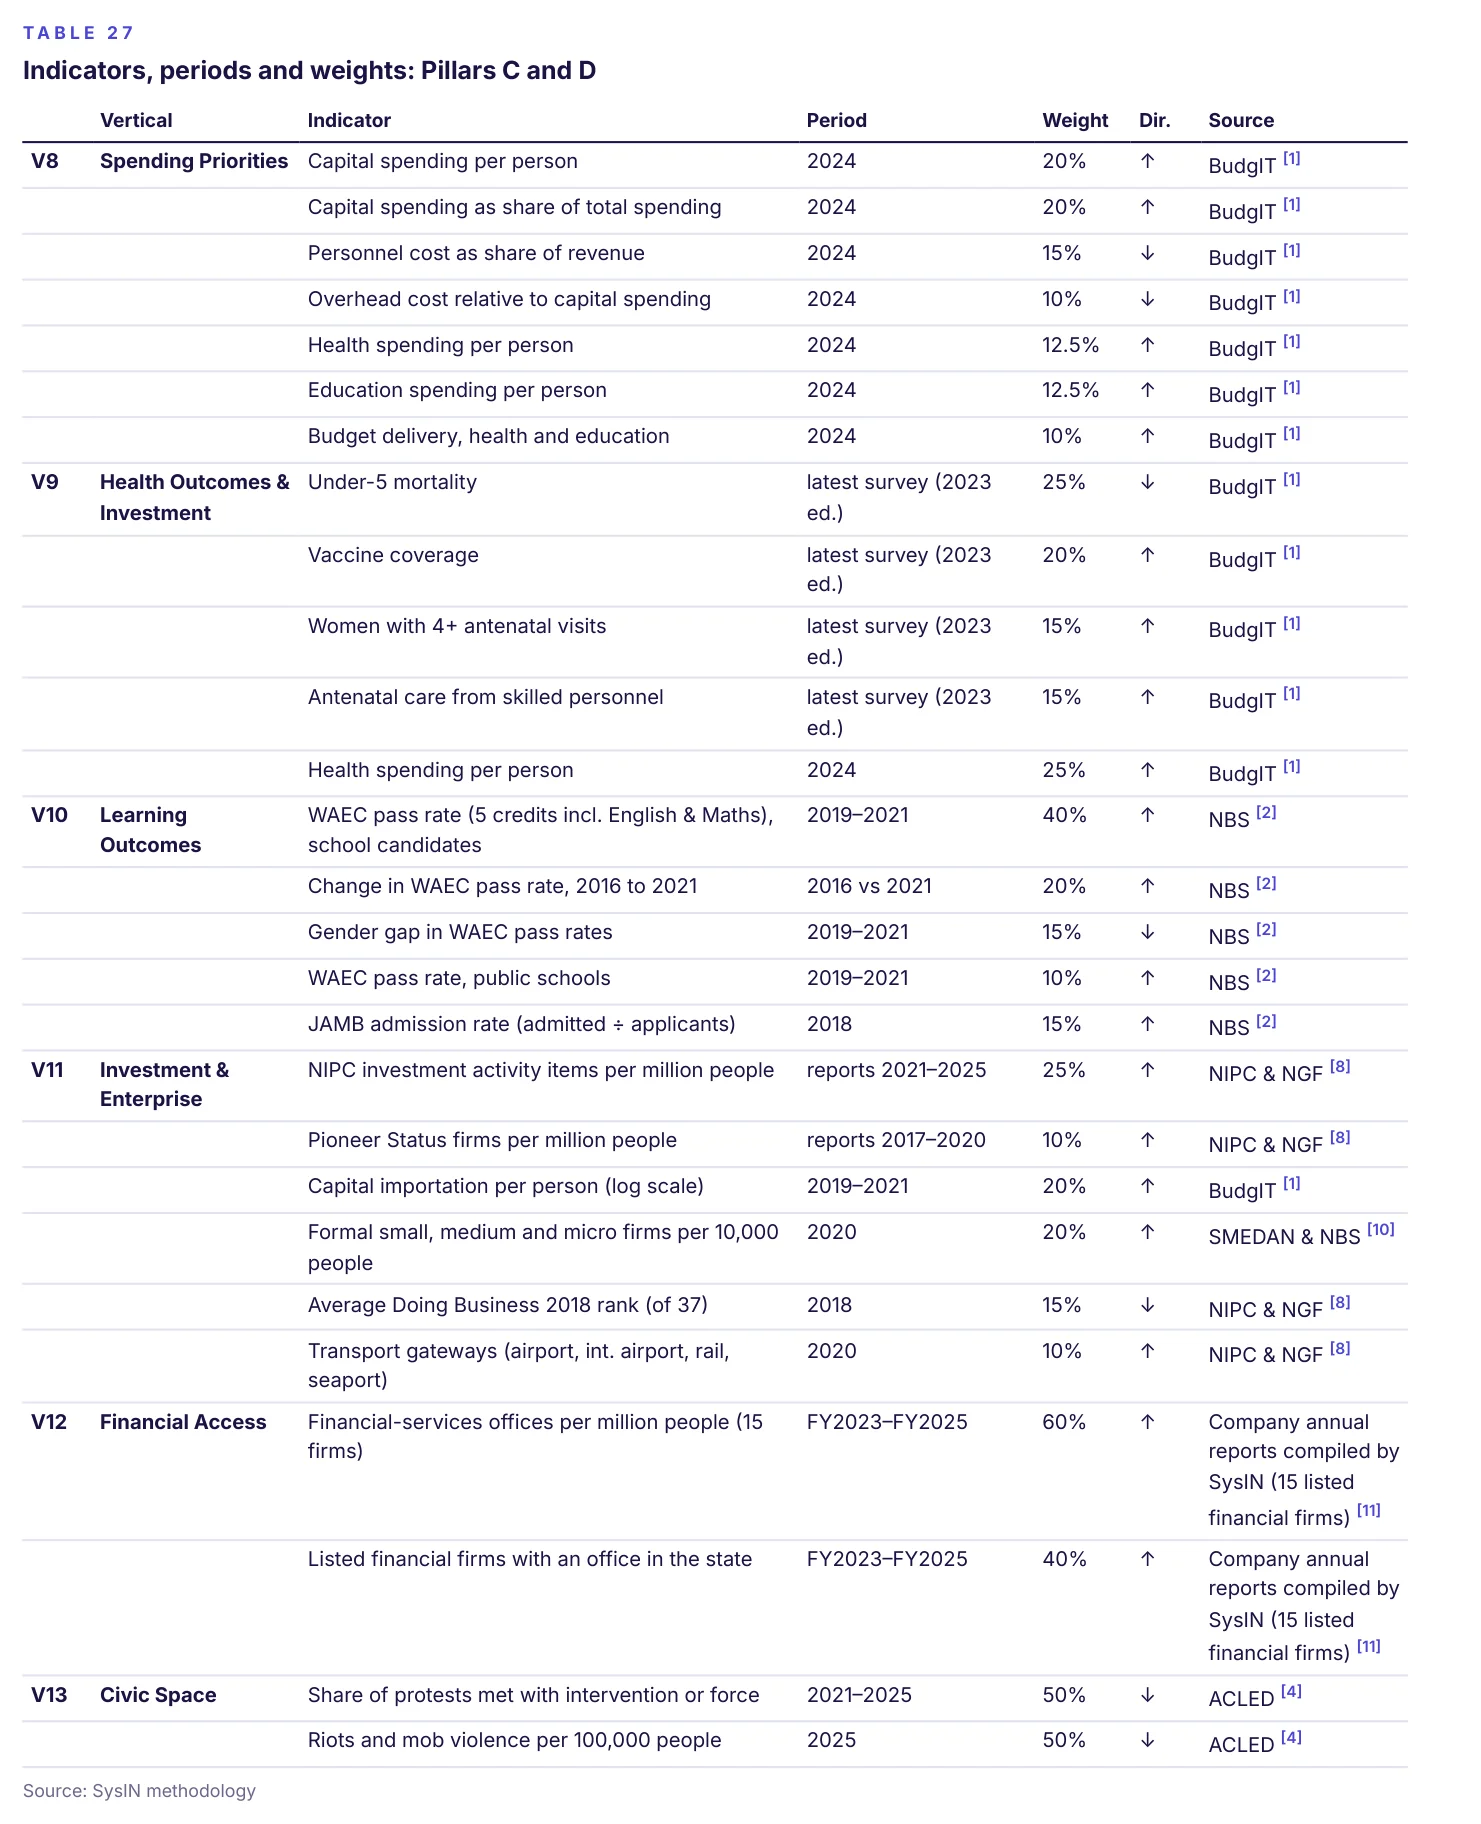
| Capital spending per person | 2024 | 20% | Higher is better |
| Capital spending as share of total spending | 2024 | 20% | Higher is better |
| Personnel cost as share of revenue | 2024 | 15% | Lower is better |
| Overhead cost relative to capital spending | 2024 | 10% | Lower is better |
| Health spending per person | 2024 | 12.5% | Higher is better |
| Education spending per person | 2024 | 12.5% | Higher is better |
| Budget delivery, health and education | 2024 | 10% | Higher is better |
Value for the Windfall
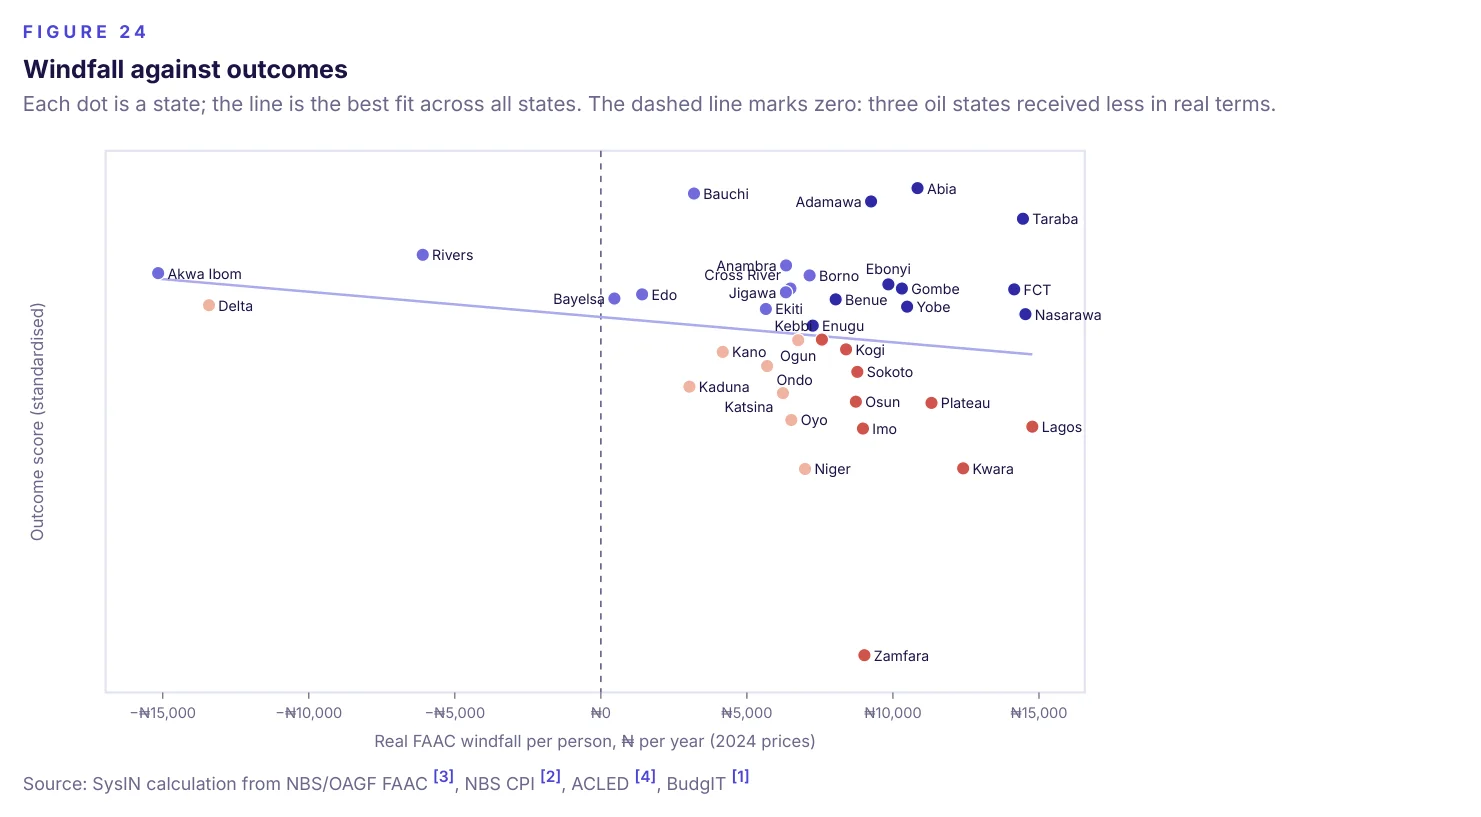
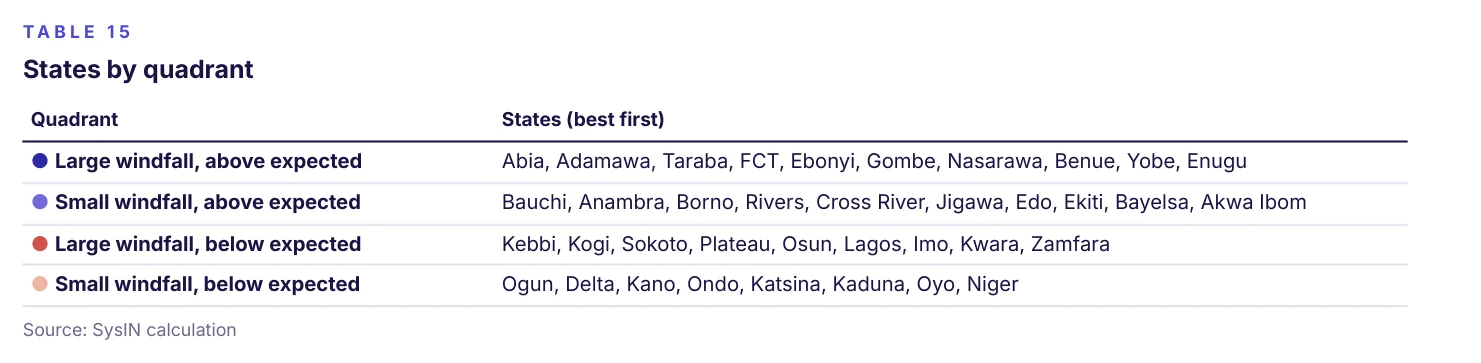
Did the extra federal money show up in residents' lives? This composite sets each state's real FAAC windfall per person against an outcome score built from three changes: the change in conflict deaths per 100,000 people since 2023, the cumulative rise in prices since May 2023 (both lower is better) and capital spending per person in 2024. The line shows the outcome a state of each windfall size would be expected to achieve; states above it did better than expected.
Health Outcomes & Investment
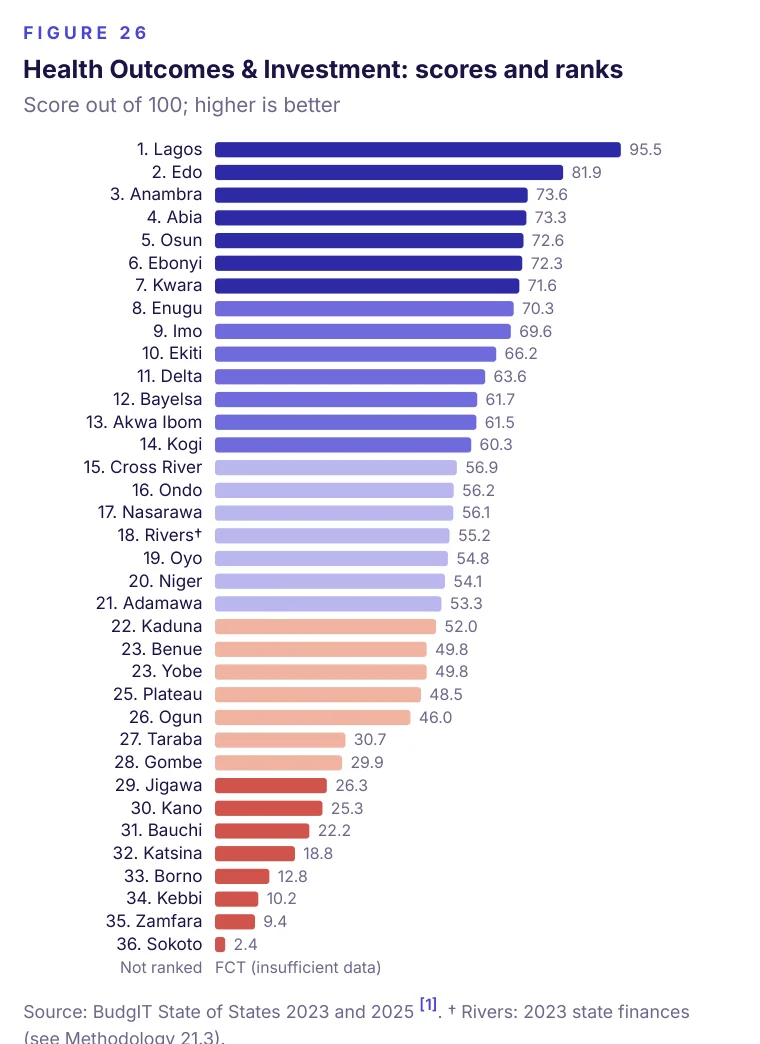
A child born in Sokoto is about 13 times as likely to die before age five as one born in Lagos [1]. Lagos, Edo and Anambra lead on health; the three lowest-ranked states are all in the North West.
Survey-based outcomes come from the BudgIT 2023 edition (latest Demographic and Health Survey figures); spending is for 2024. The FCT is not ranked because BudgIT does not cover it.
| Rank | State; † Rivers: 2023 state finances (see Methodology 21.3). | Score out of 100; higher is better |
|---|---|---|
| 1 | Lagos | 95.5 |
| 2 | Edo | 81.9 |
| 3 | Anambra | 73.6 |
| 4 | Abia | 73.3 |
| 5 | Osun | 72.6 |
| 6 | Ebonyi | 72.3 |
| 7 | Kwara | 71.6 |
| 8 | Enugu | 70.3 |
| 9 | Imo | 69.6 |
| 10 | Ekiti | 66.2 |
| 11 | Delta | 63.6 |
| 12 | Bayelsa | 61.7 |
| 13 | Akwa Ibom | 61.5 |
| 14 | Kogi | 60.3 |
| 15 | Cross River | 56.9 |
| 16 | Ondo | 56.2 |
| 17 | Nasarawa | 56.1 |
| 18 | Rivers† | 55.2 |
| 19 | Oyo | 54.8 |
| 20 | Niger | 54.1 |
| 21 | Adamawa | 53.3 |
| 22 | Kaduna | 52.0 |
| 23 | Benue | 49.8 |
| 23 | Yobe | 49.8 |
| 25 | Plateau | 48.5 |
| 26 | Ogun | 46.0 |
| 27 | Taraba | 30.7 |
| 28 | Gombe | 29.9 |
| 29 | Jigawa | 26.3 |
| 30 | Kano | 25.3 |
| 31 | Bauchi | 22.2 |
| 32 | Katsina | 18.8 |
| 33 | Borno | 12.8 |
| 34 | Kebbi | 10.2 |
| 35 | Zamfara | 9.4 |
| 36 | Sokoto | 2.4 |
| Not ranked | FCT (insufficient data) |
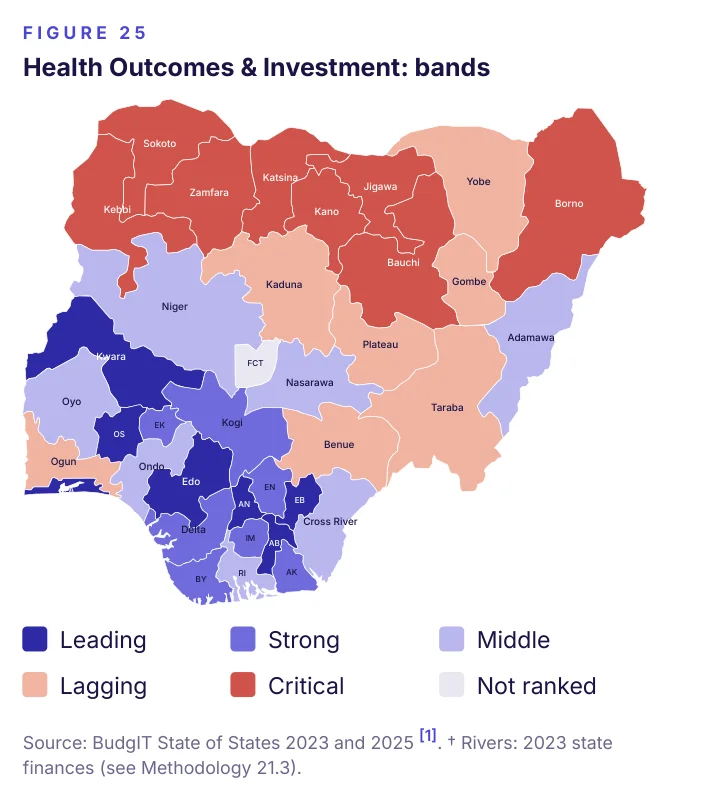
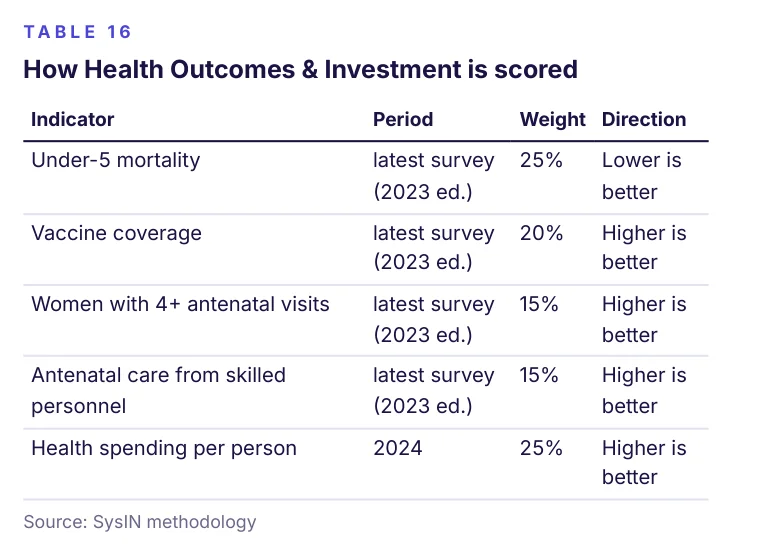
| Indicator | Period | Weight | Direction |
|---|---|---|---|
| Under-5 mortality | latest survey (2023 ed.) | 25% | Lower is better |
| Vaccine coverage | latest survey (2023 ed.) | 20% | Higher is better |
| Women with 4+ antenatal visits | latest survey (2023 ed.) | 15% | Higher is better |
| Antenatal care from skilled personnel | latest survey (2023 ed.) | 15% | Higher is better |
| Health spending per person | 2024 | 25% | Higher is better |
Learning Outcomes
Between 2019 and 2021, Abia, Rivers and Imo recorded the highest WAEC pass rates (five credits including English and Mathematics) among school candidates; Jigawa, Zamfara and Yobe the lowest [6]. JAMB admission rates, based on 2018 data, are also included [7].
These data are five to eight years old and are labelled “2019–21 data". Three 2020 public-school values (Osun, Bayelsa, Kwara) appear anomalous in the source; because including them moved Bayelsa by 17 places, they were excluded, as the methodology requires.
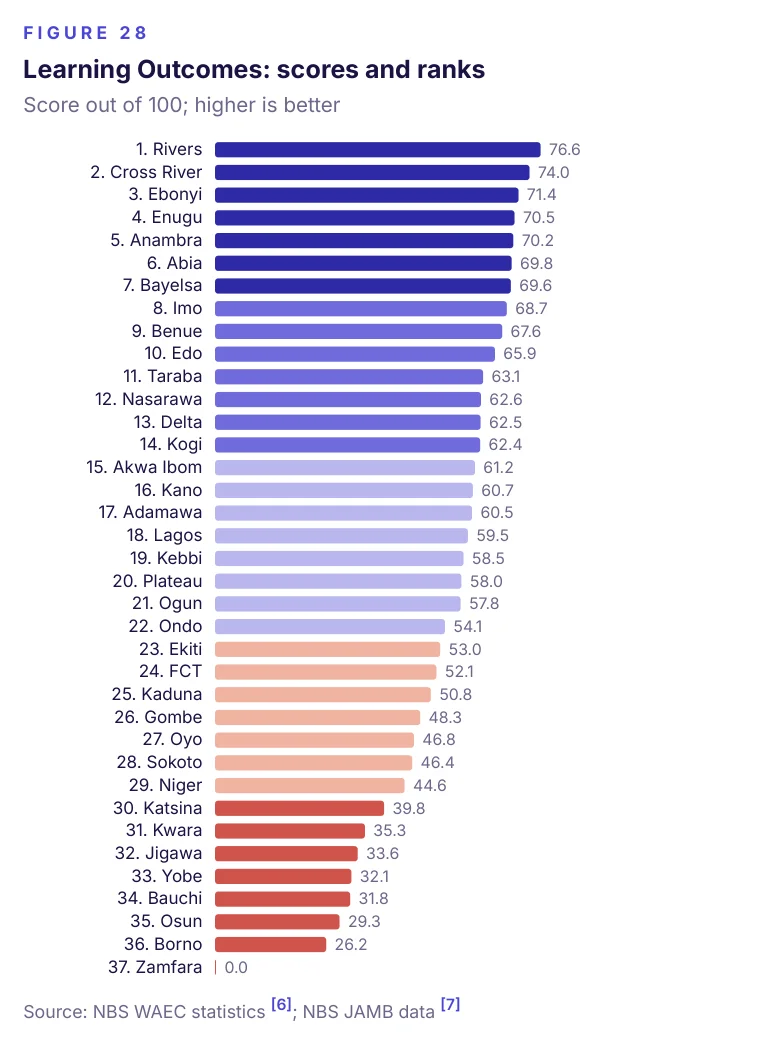
| Rank | State / FCT | Score out of 100; higher is better |
|---|---|---|
| 1 | Rivers | 76.6 |
| 2 | Cross River | 74.0 |
| 3 | Ebonyi | 71.4 |
| 4 | Enugu | 70.5 |
| 5 | Anambra | 70.2 |
| 6 | Abia | 69.8 |
| 7 | Bayelsa | 69.6 |
| 8 | Imo | 68.7 |
| 9 | Benue | 67.6 |
| 10 | Edo | 65.9 |
| 11 | Taraba | 63.1 |
| 12 | Nasarawa | 62.6 |
| 13 | Delta | 62.5 |
| 14 | Kogi | 62.4 |
| 15 | Akwa Ibom | 61.2 |
| 16 | Kano | 60.7 |
| 17 | Adamawa | 60.5 |
| 18 | Lagos | 59.5 |
| 19 | Kebbi | 58.5 |
| 20 | Plateau | 58.0 |
| 21 | Ogun | 57.8 |
| 22 | Ondo | 54.1 |
| 23 | Ekiti | 53.0 |
| 24 | FCT | 52.1 |
| 25 | Kaduna | 50.8 |
| 26 | Gombe | 48.3 |
| 27 | Oyo | 46.8 |
| 28 | Sokoto | 46.4 |
| 29 | Niger | 44.6 |
| 30 | Katsina | 39.8 |
| 31 | Kwara | 35.3 |
| 32 | Jigawa | 33.6 |
| 33 | Yobe | 32.1 |
| 34 | Bauchi | 31.8 |
| 35 | Osun | 29.3 |
| 36 | Borno | 26.2 |
| 37 | Zamfara | 0.0 |
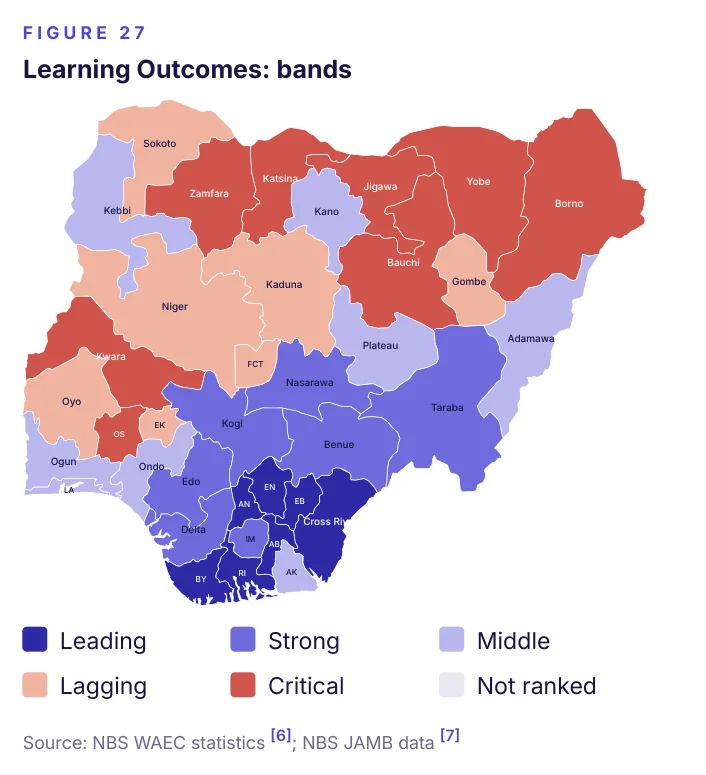
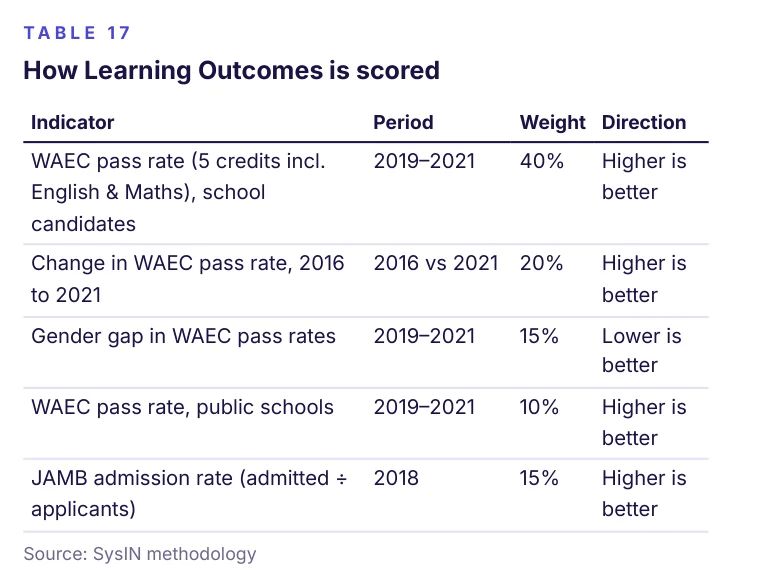
| Indicator | Period | Weight | Direction |
|---|---|---|---|
| WAEC pass rate (5 credits incl. English & Maths), school candidates | 2019–2021 | 40% | Higher is better |
| Change in WAEC pass rate, 2016 to 2021 | 2016 vs 2021 | 20% | Higher is better |
| Gender gap in WAEC pass rates | 2019–2021 | 15% | Lower is better |
| WAEC pass rate, public schools | 2019–2021 | 10% | Higher is better |
| JAMB admission rate (admitted ÷ applicants) | 2018 | 15% | Higher is better |
Investment & Enterprise
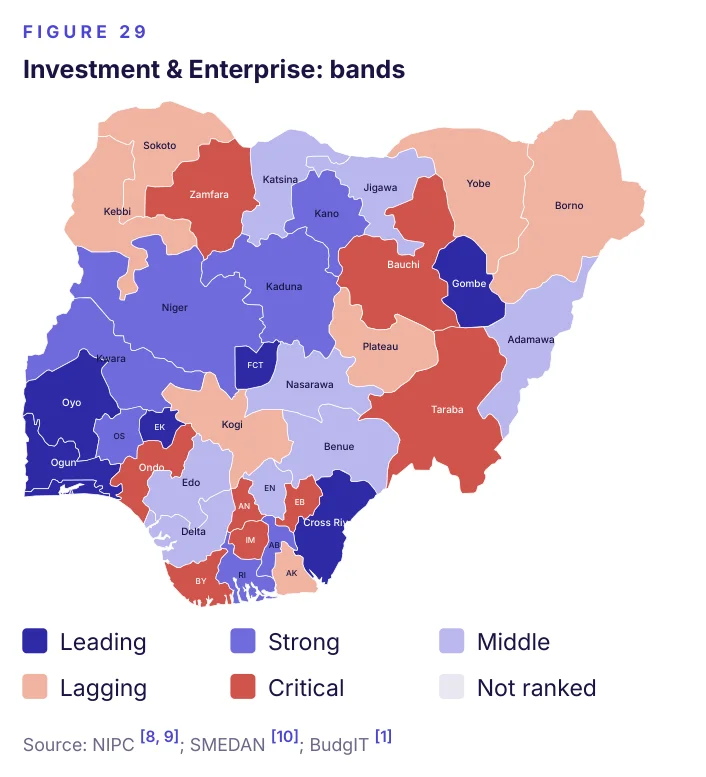
Lagos, Ogun and FCT lead on investment and enterprise, combining NIPC investment activity, capital importation, a dense base of formal firms and better Doing Business ranks [9, 8, 10]. NIPC counts describe the commission's own reported activity — announcements, facilitation and interest — and should not be read as verified investment received.
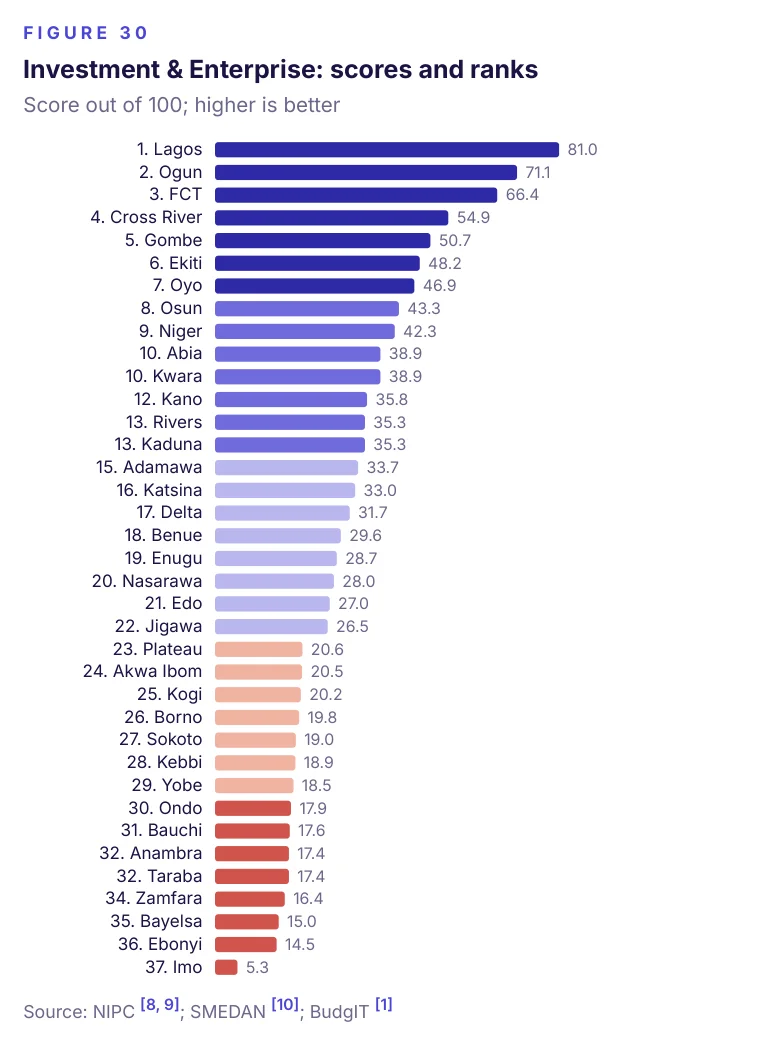
| Rank | State / FCT | Score out of 100; higher is better |
|---|---|---|
| 1 | Lagos | 81.0 |
| 2 | Ogun | 71.1 |
| 3 | FCT | 66.4 |
| 4 | Cross River | 54.9 |
| 5 | Gombe | 50.7 |
| 6 | Ekiti | 48.2 |
| 7 | Oyo | 46.9 |
| 8 | Osun | 43.3 |
| 9 | Niger | 42.3 |
| 10 | Abia | 38.9 |
| 10 | Kwara | 38.9 |
| 12 | Kano | 35.8 |
| 13 | Rivers | 35.3 |
| 13 | Kaduna | 35.3 |
| 15 | Adamawa | 33.7 |
| 16 | Katsina | 33.0 |
| 17 | Delta | 31.7 |
| 18 | Benue | 29.6 |
| 19 | Enugu | 28.7 |
| 20 | Nasarawa | 28.0 |
| 21 | Edo | 27.0 |
| 22 | Jigawa | 26.5 |
| 23 | Plateau | 20.6 |
| 24 | Akwa Ibom | 20.5 |
| 25 | Kogi | 20.2 |
| 26 | Borno | 19.8 |
| 27 | Sokoto | 19.0 |
| 28 | Kebbi | 18.9 |
| 29 | Yobe | 18.5 |
| 30 | Ondo | 17.9 |
| 31 | Bauchi | 17.6 |
| 32 | Anambra | 17.4 |
| 32 | Taraba | 17.4 |
| 34 | Zamfara | 16.4 |
| 35 | Bayelsa | 15.0 |
| 36 | Ebonyi | 14.5 |
| 37 | Imo | 5.3 |
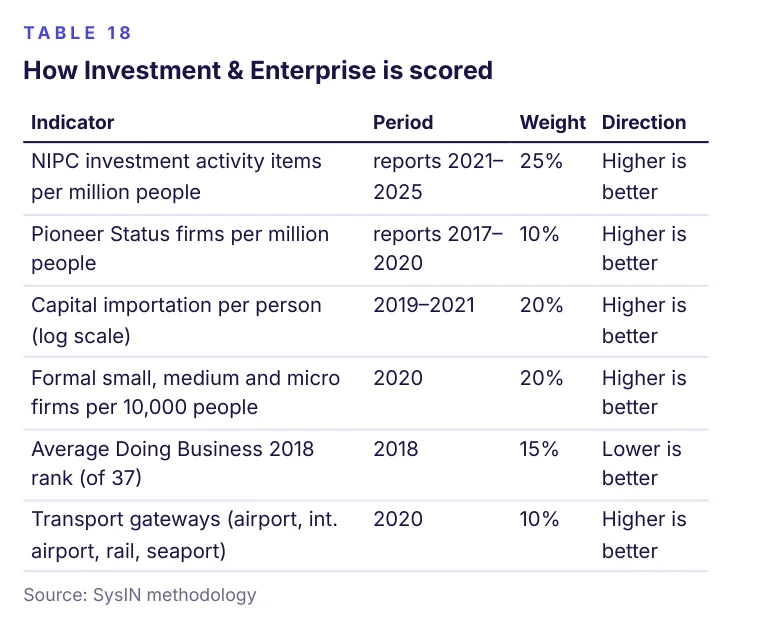
| Indicator | Period | Weight | Direction |
|---|---|---|---|
| NIPC investment activity items per million people | reports 2021–2025 | 25% | Higher is better |
| Pioneer Status firms per million people | reports 2017–2020 | 10% | Higher is better |
| Capital importation per person (log scale) | 2019–2021 | 20% | Higher is better |
| Formal small, medium and micro firms per 10,000 people | 2020 | 20% | Higher is better |
| Average Doing Business 2018 rank (of 37) | 2018 | 15% | Lower is better |
| Transport gateways (airport, int. airport, rail, seaport) | 2020 | 10% | Higher is better |
Financial Access
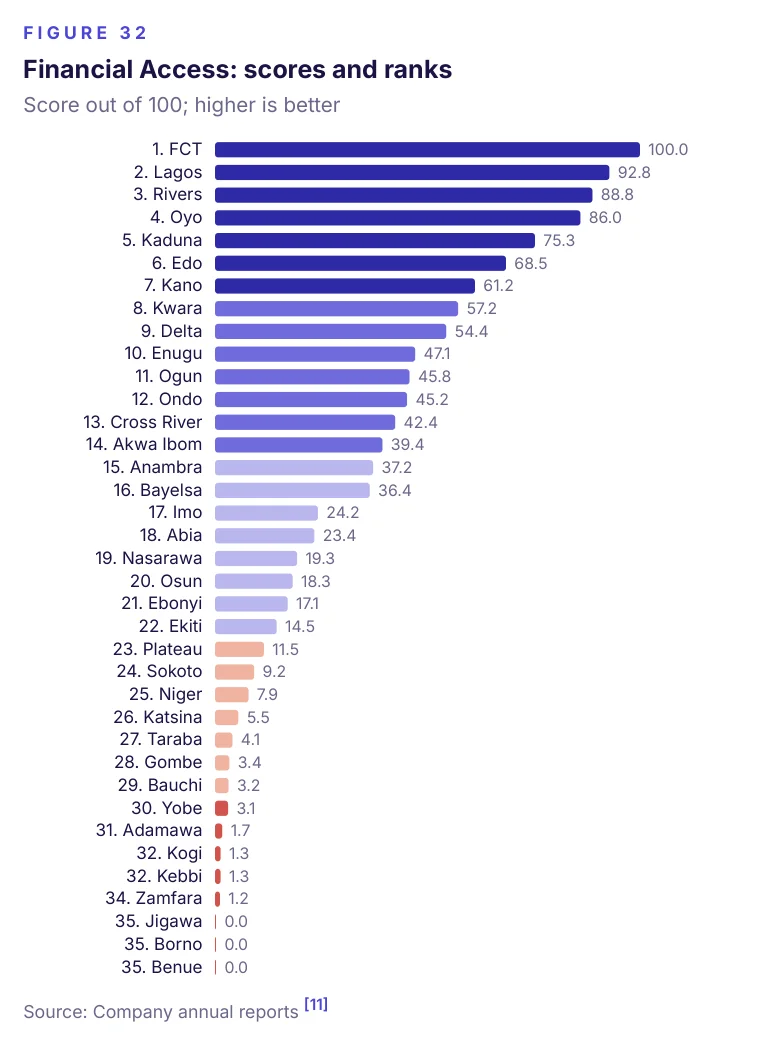
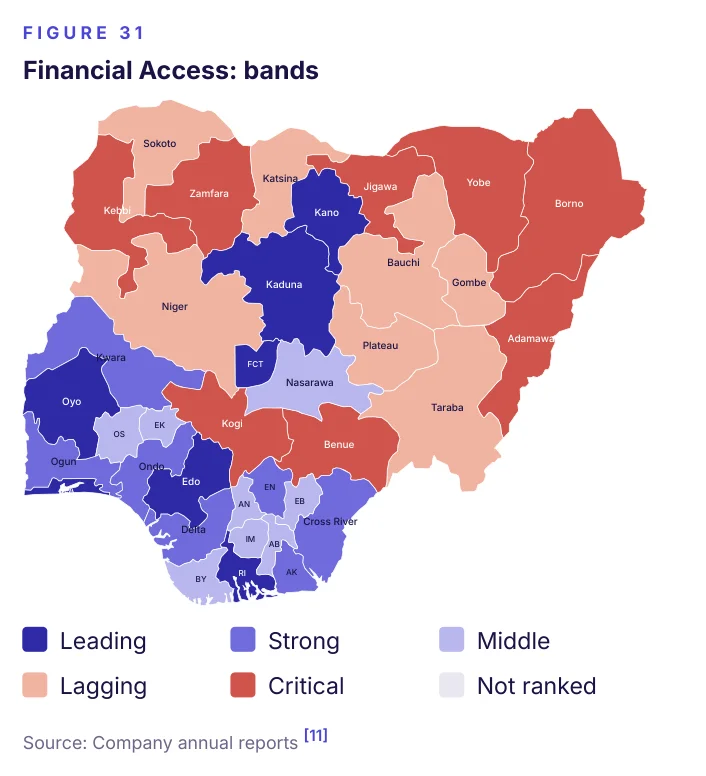
Of the 239 offices listed by the 15 firms that publish state-level branch lists, 54 are in Lagos and 25 in the FCT [11]. Benue has none. Large banks such as Access, GTCO, Zenith, UBA and FirstBank publish only national totals, so this vertical is shown as context and carries a small weight in the Investability Index only.
| Rank | State | Financial Access score out of 100; higher is better |
|---|---|---|
| 1 | FCT | 100.0 |
| 2 | Lagos | 92.8 |
| 3 | Rivers | 88.8 |
| 4 | Oyo | 86.0 |
| 5 | Kaduna | 75.3 |
| 6 | Edo | 68.5 |
| 7 | Kano | 61.2 |
| 8 | Kwara | 57.2 |
| 9 | Delta | 54.4 |
| 10 | Enugu | 47.1 |
| 11 | Ogun | 45.8 |
| 12 | Ondo | 45.2 |
| 13 | Cross River | 42.4 |
| 14 | Akwa Ibom | 39.4 |
| 15 | Anambra | 37.2 |
| 16 | Bayelsa | 36.4 |
| 17 | Imo | 24.2 |
| 18 | Abia | 23.4 |
| 19 | Nasarawa | 19.3 |
| 20 | Osun | 18.3 |
| 21 | Ebonyi | 17.1 |
| 22 | Ekiti | 14.5 |
| 23 | Plateau | 11.5 |
| 24 | Sokoto | 9.2 |
| 25 | Niger | 7.9 |
| 26 | Katsina | 5.5 |
| 27 | Taraba | 4.1 |
| 28 | Gombe | 3.4 |
| 29 | Bauchi | 3.2 |
| 30 | Yobe | 3.1 |
| 31 | Adamawa | 1.7 |
| 32 | Kogi | 1.3 |
| 32 | Kebbi | 1.3 |
| 34 | Zamfara | 1.2 |
| 35 | Jigawa | 0.0 |
| 35 | Borno | 0.0 |
| 35 | Benue | 0.0 |
| Indicator | Period | Weight | Direction |
|---|---|---|---|
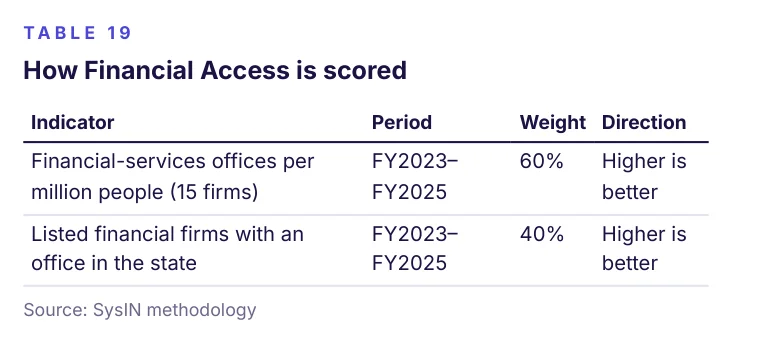
| Financial-services offices per million people (15 firms) | FY2023–FY2025 | 60% | Higher is better |
| Listed financial firms with an office in the state | FY2023–FY2025 | 40% | Higher is better |
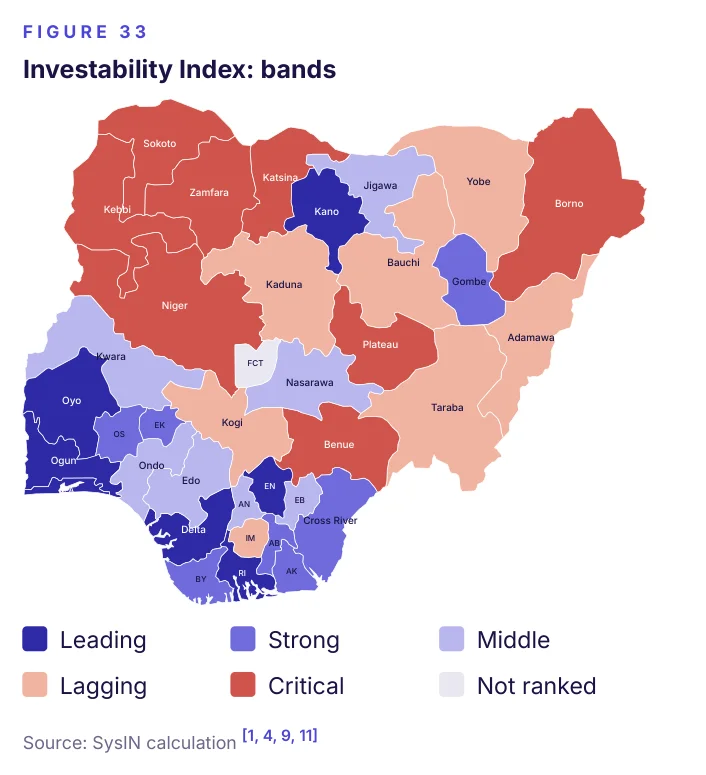
Investability Index
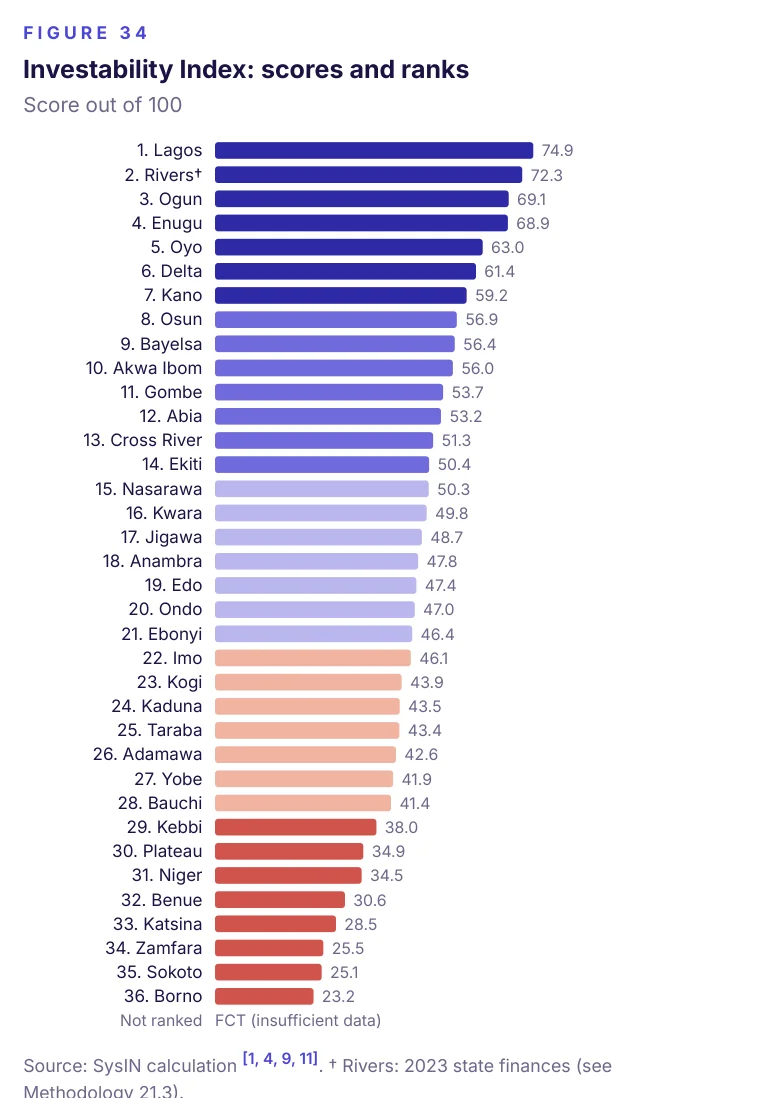
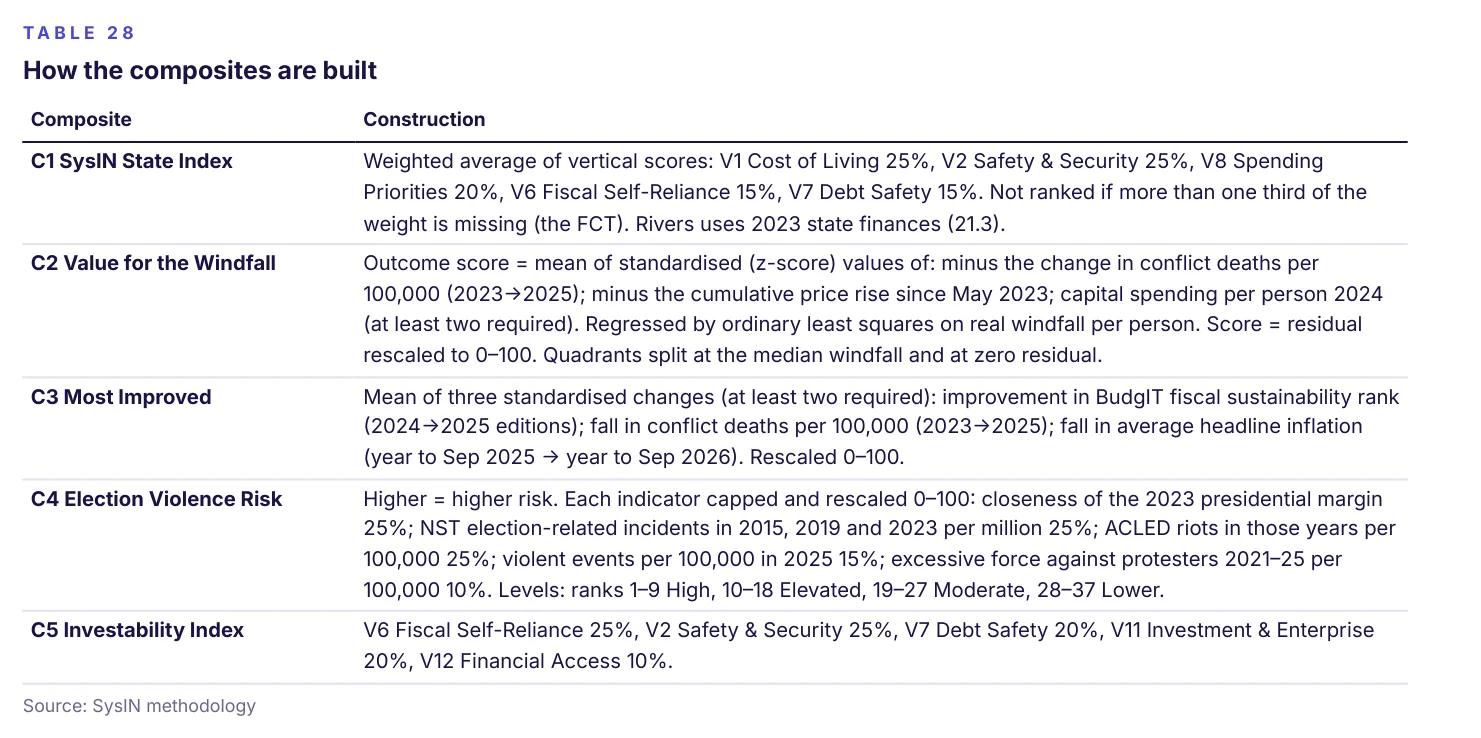
The Investability Index answers the question a bank, development-finance institution or investor asks first: where is the risk-adjusted case strongest? It weights fiscal self-reliance and safety at 25% each, debt safety and investment and enterprise at 20% each, and financial access at 10%.
Southern states with large internal revenue and low conflict rates lead. Northern states that rank well on the headline index because of low inflation, such as Jigawa and Taraba, fall back here because they raise little revenue of their own and attract little recorded investment.
| Rank | State | Investability Index score out of 100 |
|---|---|---|
| 1 | Lagos | 74.9 |
| 2 | Rivers† | 72.3 |
| 3 | Ogun | 69.1 |
| 4 | Enugu | 68.9 |
| 5 | Oyo | 63.0 |
| 6 | Delta | 61.4 |
| 7 | Kano | 59.2 |
| 8 | Osun | 56.9 |
| 9 | Bayelsa | 56.4 |
| 10 | Akwa Ibom | 56.0 |
| 11 | Gombe | 53.7 |
| 12 | Abia | 53.2 |
| 13 | Cross River | 51.3 |
| 14 | Ekiti | 50.4 |
| 15 | Nasarawa | 50.3 |
| 16 | Kwara | 49.8 |
| 17 | Jigawa | 48.7 |
| 18 | Anambra | 47.8 |
| 19 | Edo | 47.4 |
| 20 | Ondo | 47.0 |
| 21 | Ebonyi | 46.4 |
| 22 | Imo | 46.1 |
| 23 | Kogi | 43.9 |
| 24 | Kaduna | 43.5 |
| 25 | Taraba | 43.4 |
| 26 | Adamawa | 42.6 |
| 27 | Yobe | 41.9 |
| 28 | Bauchi | 41.4 |
| 29 | Kebbi | 38.0 |
| 30 | Plateau | 34.9 |
| 31 | Niger | 34.5 |
| 32 | Benue | 30.6 |
| 33 | Katsina | 28.5 |
| 34 | Zamfara | 25.5 |
| 35 | Sokoto | 25.1 |
| 36 | Borno | 23.2 |
| Not ranked | FCT (insufficient data) |
Civic Space
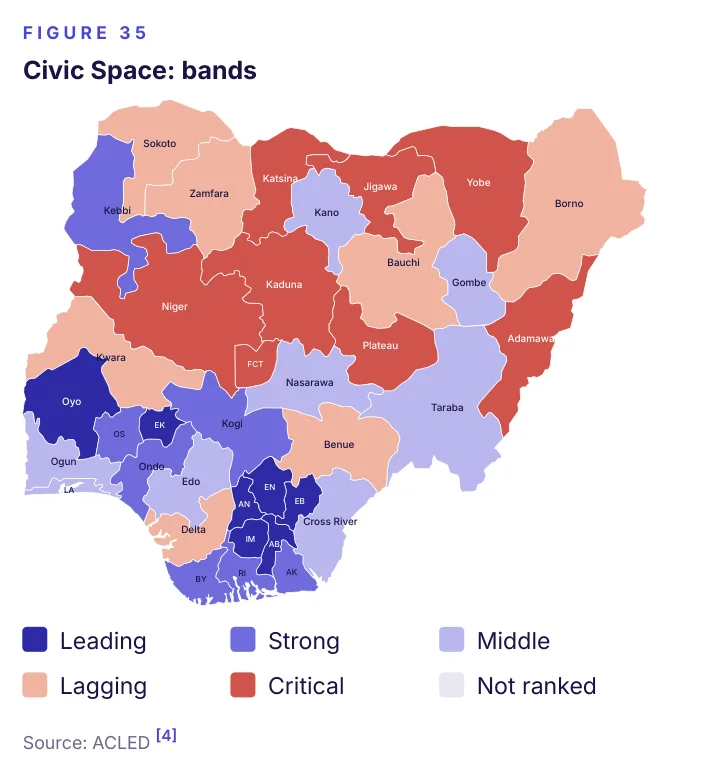
Between 2021 and 2025, security forces intervened in or used force against a median of 9% of protests in each state [4]. The share was highest in Jigawa, Adamawa and Niger. Ekiti, Ebonyi and Imo score best, combining a low share of protests met with force and few riots or episodes of mob violence.
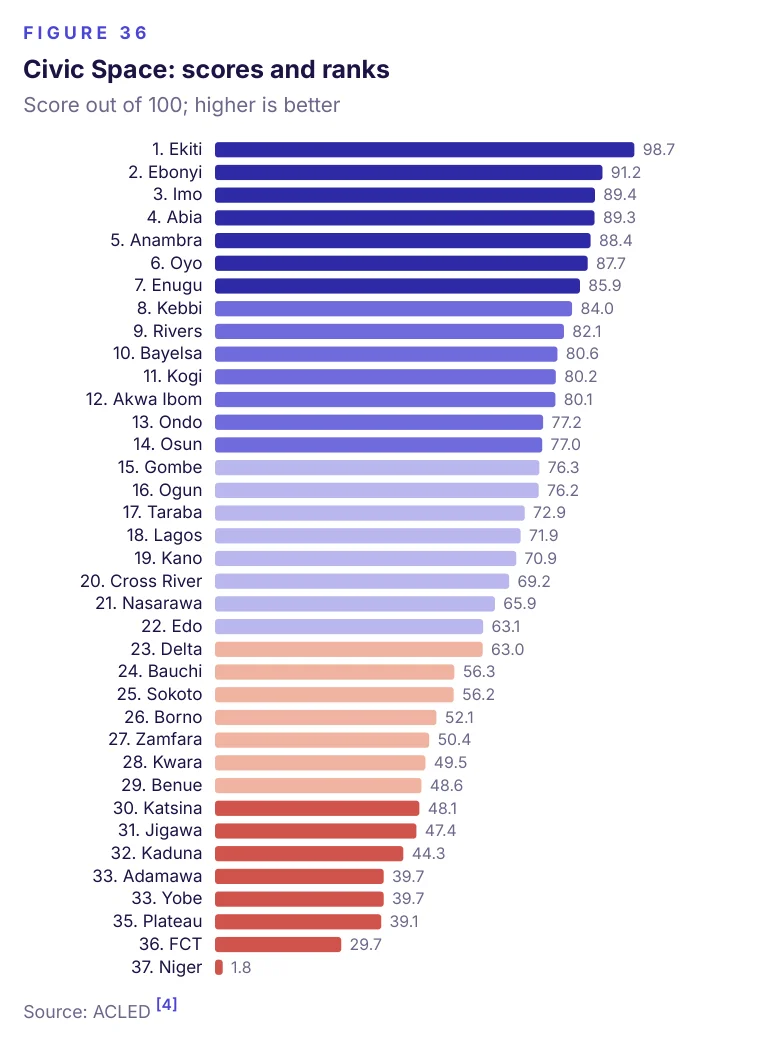
| Rank | State | Civic Space score out of 100; higher is better |
|---|---|---|
| 1 | Ekiti | 98.7 |
| 2 | Ebonyi | 91.2 |
| 3 | Imo | 89.4 |
| 4 | Abia | 89.3 |
| 5 | Anambra | 88.4 |
| 6 | Oyo | 87.7 |
| 7 | Enugu | 85.9 |
| 8 | Kebbi | 84.0 |
| 9 | Rivers | 82.1 |
| 10 | Bayelsa | 80.6 |
| 11 | Kogi | 80.2 |
| 12 | Akwa Ibom | 80.1 |
| 13 | Ondo | 77.2 |
| 14 | Osun | 77.0 |
| 15 | Gombe | 76.3 |
| 16 | Ogun | 76.2 |
| 17 | Taraba | 72.9 |
| 18 | Lagos | 71.9 |
| 19 | Kano | 70.9 |
| 20 | Cross River | 69.2 |
| 21 | Nasarawa | 65.9 |
| 22 | Edo | 63.1 |
| 23 | Delta | 63.0 |
| 24 | Bauchi | 56.3 |
| 25 | Sokoto | 56.2 |
| 26 | Borno | 52.1 |
| 27 | Zamfara | 50.4 |
| 28 | Kwara | 49.5 |
| 29 | Benue | 48.6 |
| 30 | Katsina | 48.1 |
| 31 | Jigawa | 47.4 |
| 32 | Kaduna | 44.3 |
| 33 | Adamawa | 39.7 |
| 33 | Yobe | 39.7 |
| 35 | Plateau | 39.1 |
| 36 | FCT | 29.7 |
| 37 | Niger | 1.8 |
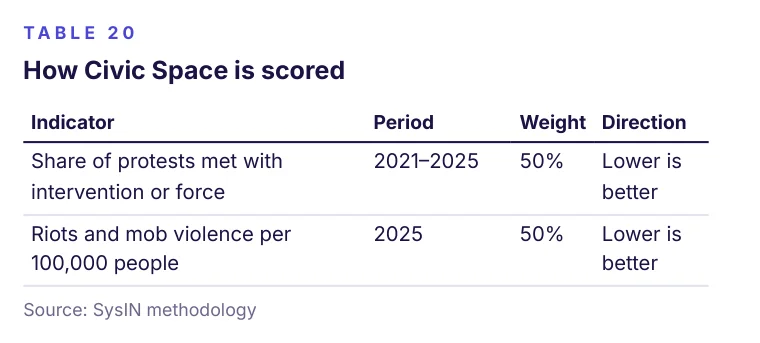
| Indicator | Period | Weight | Direction |
|---|---|---|---|
| Share of protests met with intervention or force | 2021–2025 | 50% | Lower is better |
| Riots and mob violence per 100,000 people | 2025 | 50% | Lower is better |
The electoral landscape
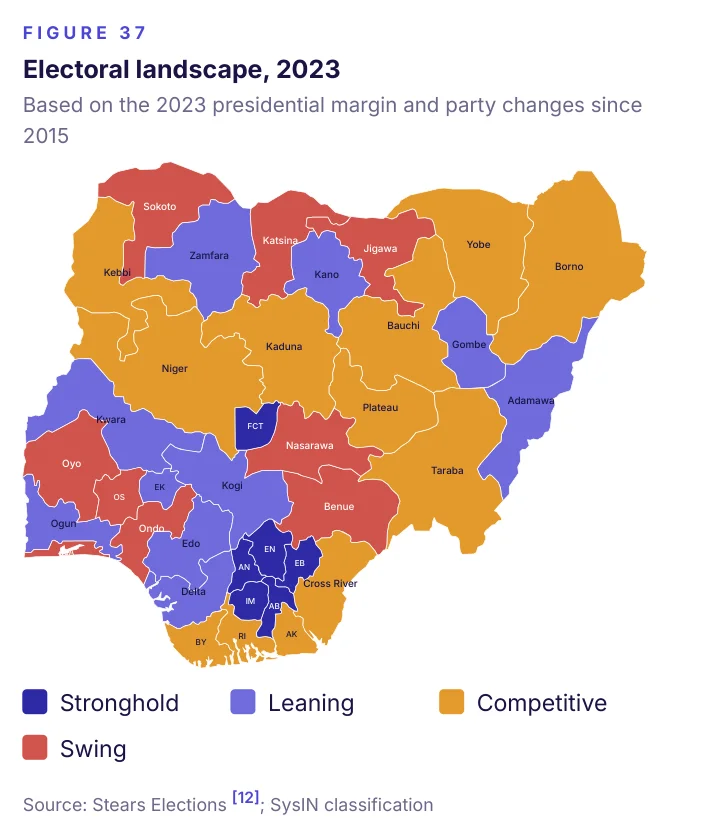
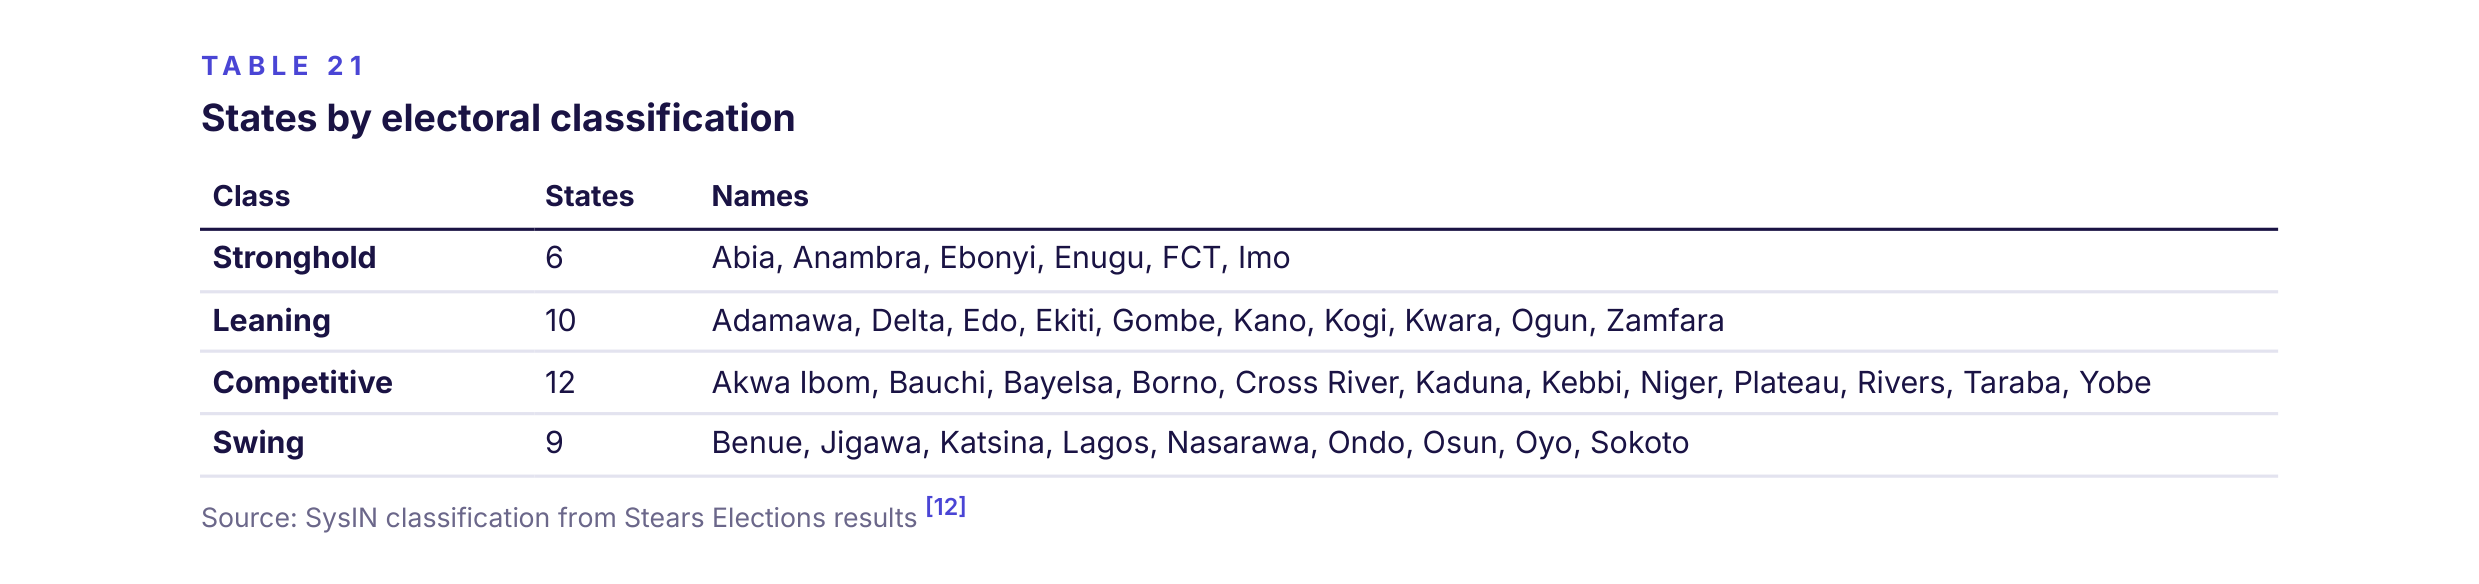
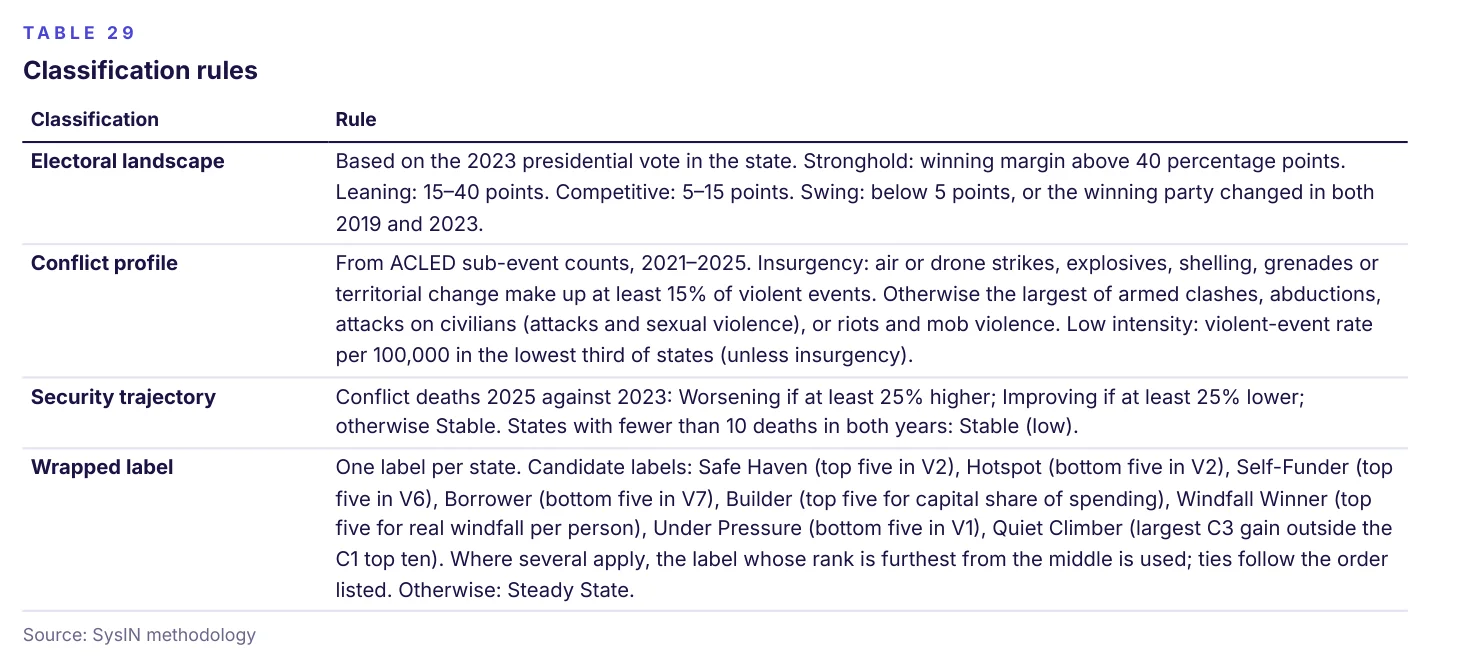
SysIN classifies each state by how contested its presidential vote has been. A Stronghold was won by more than 40 percentage points in 2023; a Leaning state by 15–40 points; a Competitive state by 5–15 points. A Swing state was won by less than 5 points, or changed its winning party in both 2019 and 2023.
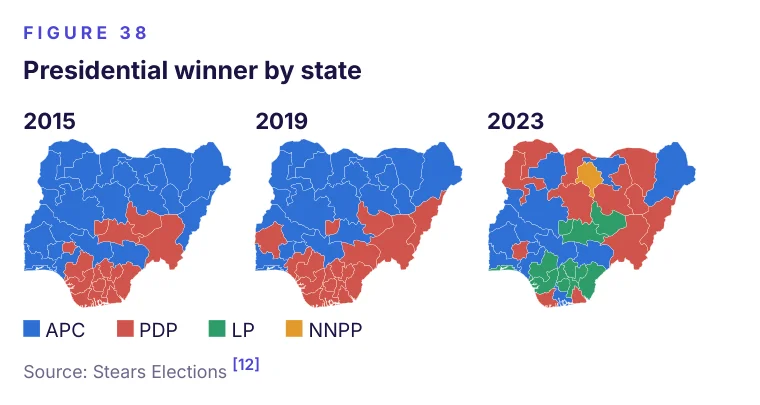
The 2023 election broke the two-party pattern of 2015 and 2019. The LP won twelve, including all five South East states, Lagos and the FCT, and the NNPP won Kano. The effective number of parties in the presidential vote averaged 2.4 across states, against 1.9 in 2019.
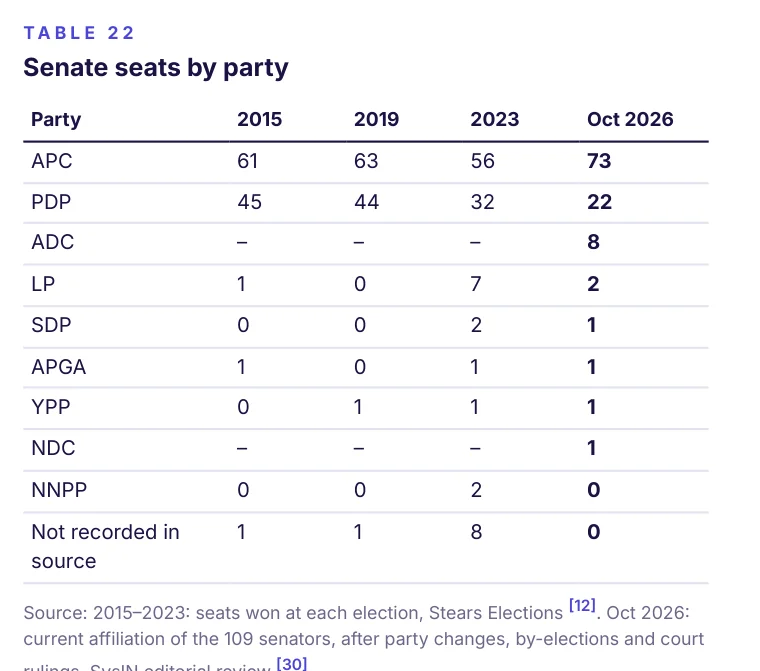
| Party | 2015 | 2019 | 2023 | Oct 2026 |
|---|---|---|---|---|
| APC | 61 | 63 | 56 | 73 |
| PDP | 45 | 44 | 32 | 22 |
| ADC | – | – | – | 8 |
| LP | 1 | 0 | 7 | 2 |
| SDP | 0 | 0 | 2 | 1 |
| APGA | 1 | 0 | 1 | 1 |
| YPP | 0 | 1 | 1 | 1 |
| NDC | – | – | – | 1 |
| NNPP | 0 | 0 | 2 | 0 |
| Not recorded in source | 1 | 1 | 8 | 0 |
Election Violence Risk
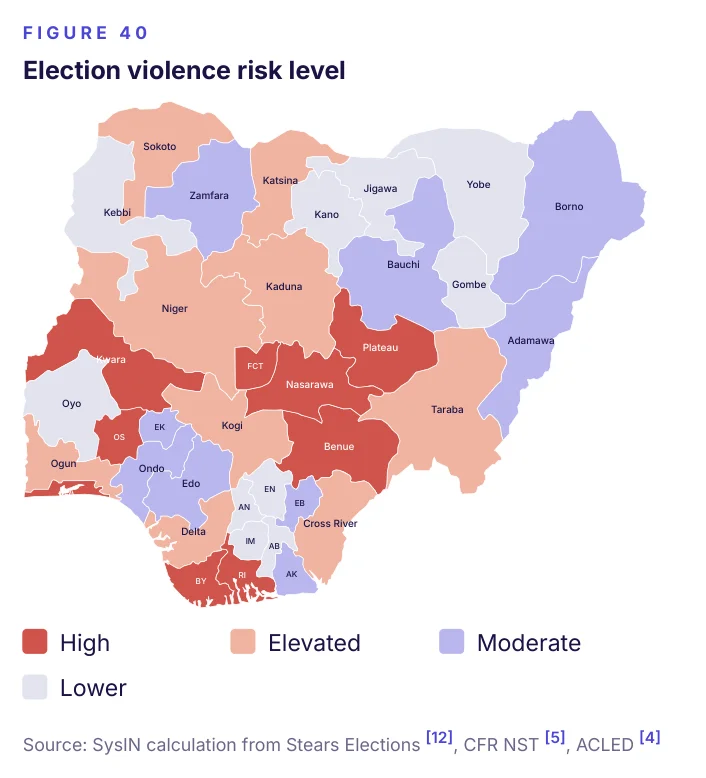
This composite identifies where the 2027 elections may be most at risk of violence. It combines five indicators: how close the 2023 presidential race was (25%); violent incidents involving election-related actors in 2015, 2019 and 2023, per million residents (25%); riots in those election years, per 100,000 (25%); current levels of violence (15%); and excessive force against protesters since 2021 (10%) [12, 5, 4].
It is a risk indicator, not a forecast. A high score signals that observers, security agencies and the media should watch closely; it does not predict that violence will occur. States are grouped in four levels of nine or ten states each.
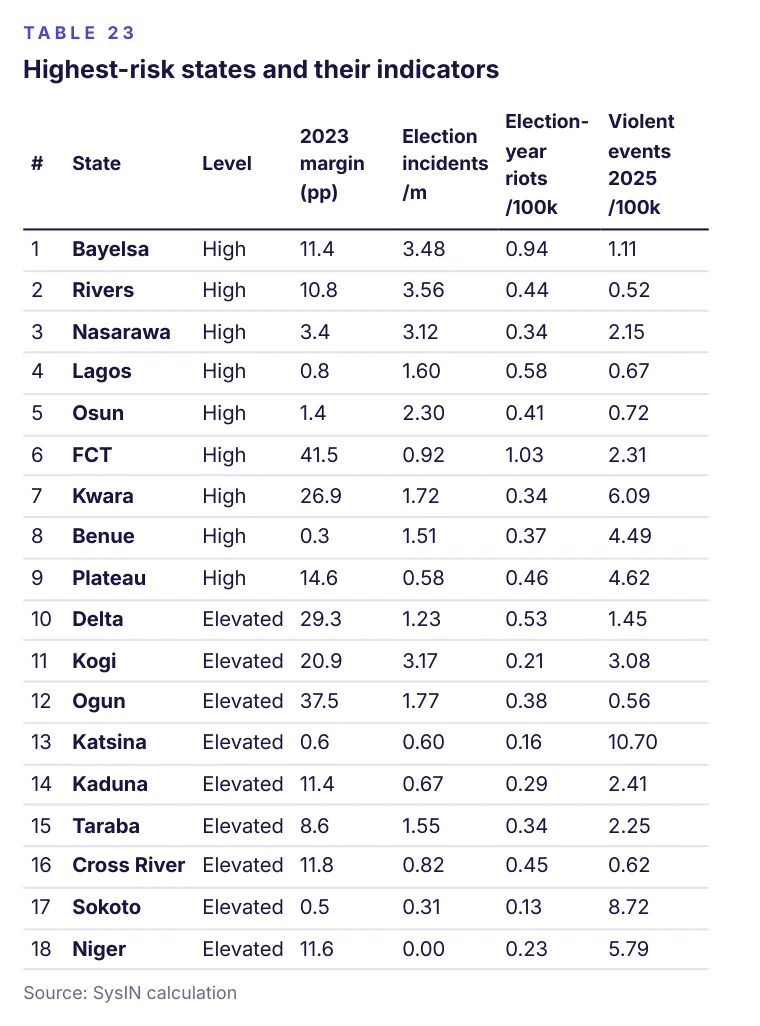
| # | State | Level | 2023 margin (pp) | Election incidents /m | Election-year riots /100k | Violent events 2025 /100k |
|---|---|---|---|---|---|---|
| 1 | Bayelsa | High | 11.4 | 3.48 | 0.94 | 1.11 |
| 2 | Rivers | High | 10.8 | 3.56 | 0.44 | 0.52 |
| 3 | Nasarawa | High | 3.4 | 3.12 | 0.34 | 2.15 |
| 4 | Lagos | High | 0.8 | 1.60 | 0.58 | 0.67 |
| 5 | Osun | High | 1.4 | 2.30 | 0.41 | 0.72 |
| 6 | FCT | High | 41.5 | 0.92 | 1.03 | 2.31 |
| 7 | Kwara | High | 26.9 | 1.72 | 0.34 | 6.09 |
| 8 | Benue | High | 0.3 | 1.51 | 0.37 | 4.49 |
| 9 | Plateau | High | 14.6 | 0.58 | 0.46 | 4.62 |
| 10 | Delta | Elevated | 29.3 | 1.23 | 0.53 | 1.45 |
| 11 | Kogi | Elevated | 20.9 | 3.17 | 0.21 | 3.08 |
| 12 | Ogun | Elevated | 37.5 | 1.77 | 0.38 | 0.56 |
| 13 | Katsina | Elevated | 0.6 | 0.60 | 0.16 | 10.70 |
| 14 | Kaduna | Elevated | 11.4 | 0.67 | 0.29 | 2.41 |
| 15 | Taraba | Elevated | 8.6 | 1.55 | 0.34 | 2.25 |
| 16 | Cross River | Elevated | 11.8 | 0.82 | 0.45 | 0.62 |
| 17 | Sokoto | Elevated | 0.5 | 0.31 | 0.13 | 8.72 |
| 18 | Niger | Elevated | 11.6 | 0.00 | 0.23 | 5.79 |
Most Improved
This composite rewards change rather than level, so states that start from a weak position can rank highly. It averages three standardised changes: the movement in BudgIT's fiscal sustainability rank between its 2024 and 2025 editions [1]; the change in conflict deaths per 100,000 people between 2023 and 2025 [4]; and the change in average headline inflation between the year to September 2025 and the year to September 2026 [2].
Zamfara's fall reflects a sharp rise in conflict deaths; Cross River fell from 5th to 30th in BudgIT's fiscal ranking.
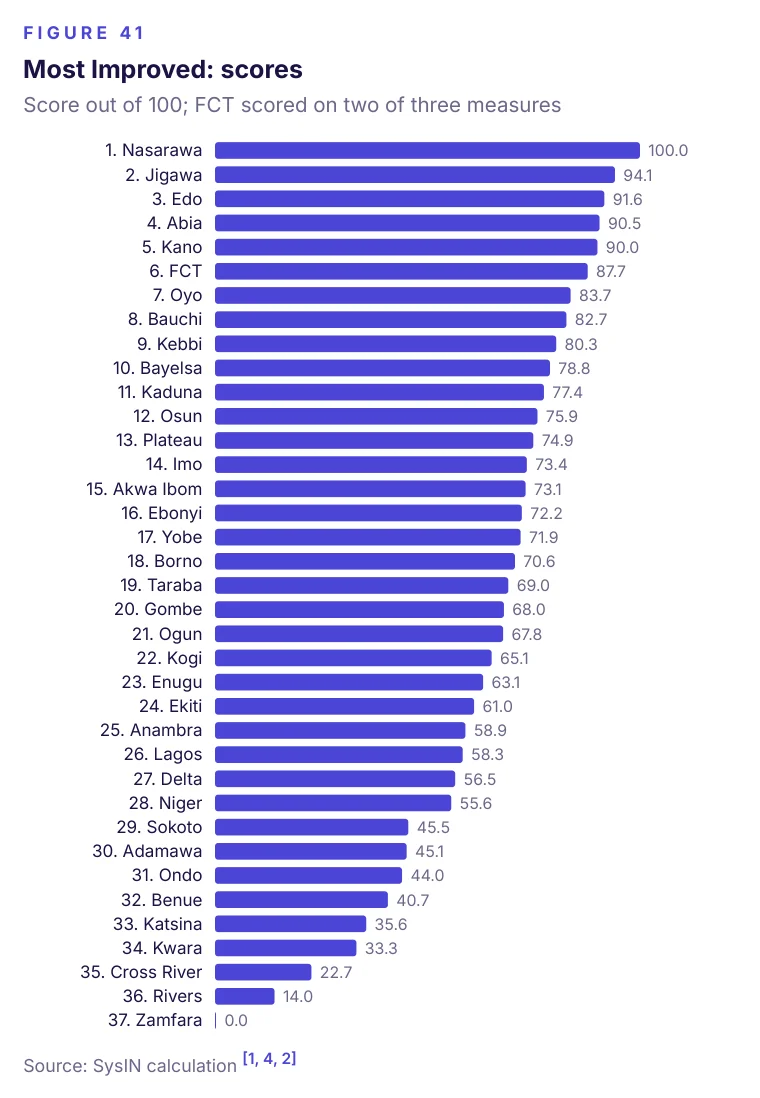
| Rank | State | Score out of 100; FCT scored on two of three measures |
|---|---|---|
| 1 | Nasarawa | 100.0 |
| 2 | Jigawa | 94.1 |
| 3 | Edo | 91.6 |
| 4 | Abia | 90.5 |
| 5 | Kano | 90.0 |
| 6 | FCT | 87.7 |
| 7 | Oyo | 83.7 |
| 8 | Bauchi | 82.7 |
| 9 | Kebbi | 80.3 |
| 10 | Bayelsa | 78.8 |
| 11 | Kaduna | 77.4 |
| 12 | Osun | 75.9 |
| 13 | Plateau | 74.9 |
| 14 | Imo | 73.4 |
| 15 | Akwa Ibom | 73.1 |
| 16 | Ebonyi | 72.2 |
| 17 | Yobe | 71.9 |
| 18 | Borno | 70.6 |
| 19 | Taraba | 69.0 |
| 20 | Gombe | 68.0 |
| 21 | Ogun | 67.8 |
| 22 | Kogi | 65.1 |
| 23 | Enugu | 63.1 |
| 24 | Ekiti | 61.0 |
| 25 | Anambra | 58.9 |
| 26 | Lagos | 58.3 |
| 27 | Delta | 56.5 |
| 28 | Niger | 55.6 |
| 29 | Sokoto | 45.5 |
| 30 | Adamawa | 45.1 |
| 31 | Ondo | 44.0 |
| 32 | Benue | 40.7 |
| 33 | Katsina | 35.6 |
| 34 | Kwara | 33.3 |
| 35 | Cross River | 22.7 |
| 36 | Rivers | 14.0 |
| 37 | Zamfara | 0.0 |
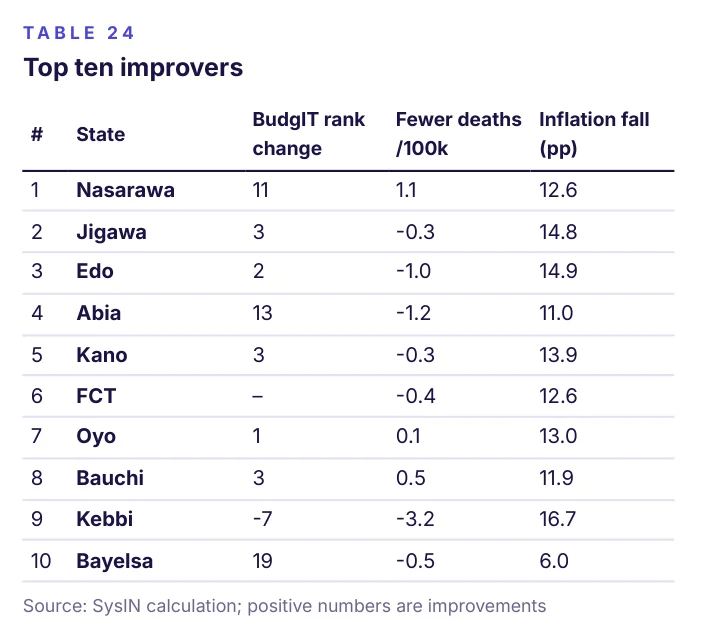
| # | State | BudgIT rank change | Fewer deaths /100k | Inflation fall (pp) |
|---|---|---|---|---|
| 1 | Nasarawa | 11 | 1.1 | 12.6 |
| 2 | Jigawa | 3 | -0.3 | 14.8 |
| 3 | Edo | 2 | -1.0 | 14.9 |
| 4 | Abia | 13 | -1.2 | 11.0 |
| 5 | Kano | 3 | -0.3 | 13.9 |
| 6 | FCT | – | -0.4 | 12.6 |
| 7 | Oyo | 1 | 0.1 | 13.0 |
| 8 | Bauchi | 3 | 0.5 | 11.9 |
| 9 | Kebbi | -7 | -3.2 | 16.7 |
| 10 | Bayelsa | 19 | -0.5 | 6.0 |
Abia state profile
Abia ranks 4 of 36 on the SysIN State Index, in the leading band. Its strongest result is in Spending Priorities (1 of 36) and its weakest in Debt Safety (25 of 36). Headline inflation averaged 16.5% over the twelve months to September 2026 [2], and ACLED recorded 94 conflict deaths in 2025 (2.0 per 100,000 residents) [4]. Net FAAC receipts rose 225% in naira terms after the subsidy removal, a real gain of 50% once its inflation is taken into account [3].
Presidential winner: PDP (2015), PDP (2019), LP (2023). Highest average presidential vote share across the three elections: PDP (56%). Senate seats won in 2023: APC 1, LP 1, APGA 1; held in October 2026: ADC 1, APC 1, APGA 1. Classified Stronghold (2023 margin 82.3 points).
Adamawa state profile
Adamawa ranks 27 of 36 on the SysIN State Index, in the lagging band. Its strongest result is in FAAC Windfall (12 of 37) and its weakest in Civic Space (33 of 37). Headline inflation averaged 17.4% over the twelve months to September 2026 [2], and ACLED recorded 131 conflict deaths in 2025 (2.4 per 100,000 residents) [4]. Net FAAC receipts rose 206% in naira terms after the subsidy removal, a real gain of 51% once its inflation is taken into account [3].
Presidential winner: APC (2015), PDP (2019), PDP (2023). Highest average presidential vote share across the three elections: PDP (49%). Senate seats won in 2023: APC 1, PDP 2; held in October 2026: PDP 3. Classified Leaning (2023 margin 32.1 points).
Akwa Ibom state profile
Akwa Ibom ranks 1 of 36 on the SysIN State Index, in the leading band. Its strongest result is in Debt Safety (1 of 36) and its weakest in FAAC Windfall (35 of 37). Headline inflation averaged 17.0% over the twelve months to September 2026 [2], and ACLED recorded 16 conflict deaths in 2025 (0.2 per 100,000 residents) [4]. Net FAAC receipts rose 63% in naira terms after the subsidy removal, a real fall of 21% once its inflation is taken into account [3].
Presidential winner: PDP (2015), PDP (2019), PDP (2023). Highest average presidential vote share across the three elections: PDP (67%). Senate seats won in 2023: APC 1, PDP 2; held in October 2026: APC 3. Classified Competitive (2023 margin 9.6 points).
Anambra state profile
Anambra ranks 14 of 36 on the SysIN State Index, in the strong band. Its strongest result is in Health Outcomes & Investment (3 of 36) and its weakest in Investment & Enterprise (32 of 37). Headline inflation averaged 17.5% over the twelve months to September 2026 [2], and ACLED recorded 160 conflict deaths in 2025 (2.3 per 100,000 residents) [4]. Net FAAC receipts rose 181% in naira terms after the subsidy removal, a real gain of 35% once its inflation is taken into account [3].
Presidential winner: PDP (2015), PDP (2019), LP (2023). Highest average presidential vote share across the three elections: PDP (61%). Senate seats won in 2023: LP 2, YPP 1; held in October 2026: LP 2, YPP 1. Classified Stronghold (2023 margin 93.8 points).
Bauchi state profile
Bauchi ranks 12 of 36 on the SysIN State Index, in the strong band. Its strongest result is in Civilian Protection (2 of 37) and its weakest in Learning Outcomes (34 of 37). Headline inflation averaged 14.7% over the twelve months to September 2026 [2], and ACLED recorded 61 conflict deaths in 2025 (0.7 per 100,000 residents) [4]. Net FAAC receipts rose 169% in naira terms after the subsidy removal, a real gain of 26% once its inflation is taken into account [3].
Presidential winner: APC (2015), APC (2019), PDP (2023). Highest average presidential vote share across the three elections: APC (69%). Senate seats won in 2023: APC 1, PDP 2; held in October 2026: PDP 2, APC 1. Classified Competitive (2023 margin 12.9 points).
Bayelsa state profile
Bayelsa ranks 9 of 36 on the SysIN State Index, in the strong band. Its strongest result is in Spending Priorities (2 of 36) and its weakest in Cost of Living Pressure (35 of 37). Headline inflation averaged 17.6% over the twelve months to September 2026 [2], and ACLED recorded 27 conflict deaths in 2025 (0.9 per 100,000 residents) [4]. Net FAAC receipts rose 108% in naira terms after the subsidy removal, a real gain of 0% once its inflation is taken into account [3].
Presidential winner: PDP (2015), PDP (2019), PDP (2023). Highest average presidential vote share across the three elections: PDP (67%). Senate seats won in 2023: APC 1, PDP 2; held in October 2026: PDP 2, NDC 1. Classified Competitive (2023 margin 11.4 points).
Benue state profile
Benue ranks 34 of 36 on the SysIN State Index, in the critical band. Its strongest result is in FAAC Windfall (7 of 37) and its weakest in Financial Access (35 of 37). Headline inflation averaged 17.2% over the twelve months to September 2026 [2], and ACLED recorded 882 conflict deaths in 2025 (12.1 per 100,000 residents) [4]. Net FAAC receipts rose 209% in naira terms after the subsidy removal, a real gain of 58% once its inflation is taken into account [3].
Presidential winner: APC (2015), PDP (2019), APC (2023). Highest average presidential vote share across the three elections: APC (48%). Senate seats won in 2023: APC 2, PDP 1; held in October 2026: APC 2, PDP 1. Classified Swing (2023 margin 0.3 points).
Borno state profile
Borno ranks 28 of 36 on the SysIN State Index, in the lagging band. Its strongest result is in Cost of Living Pressure (2 of 37) and its weakest in Safety & Security (36 of 37). Headline inflation averaged 11.7% over the twelve months to September 2026 [2], and ACLED recorded 3,862 conflict deaths in 2025 (50.2 per 100,000 residents) [4]. Net FAAC receipts rose 192% in naira terms after the subsidy removal, a real gain of 49% once its inflation is taken into account [3].
Presidential winner: APC (2015), APC (2019), APC (2023). Highest average presidential vote share across the three elections: APC (80%). Senate seats won in 2023: APC 3; held in October 2026: APC 3. Classified Competitive (2023 margin 13.2 points).
Cross River state profile
Cross River ranks 25 of 36 on the SysIN State Index, in the lagging band. Its strongest result is in Learning Outcomes (2 of 37) and its weakest in Spending Priorities (34 of 36). Headline inflation averaged 15.9% over the twelve months to September 2026 [2], and ACLED recorded 34 conflict deaths in 2025 (0.7 per 100,000 residents) [4]. Net FAAC receipts rose 185% in naira terms after the subsidy removal, a real gain of 39% once its inflation is taken into account [3].
Presidential winner: PDP (2015), PDP (2019), LP (2023). Highest average presidential vote share across the three elections: PDP (62%). Senate seats won in 2023: APC 2, PDP 1; held in October 2026: APC 2, PDP 1. Classified Competitive (2023 margin 11.8 points).
Delta state profile
Delta ranks 15 of 36 on the SysIN State Index, in the middle band. Its strongest result is in Debt Safety (3 of 36) and its weakest in FAAC Windfall (36 of 37). Headline inflation averaged 17.7% over the twelve months to September 2026 [2], and ACLED recorded 114 conflict deaths in 2025 (1.6 per 100,000 residents) [4]. Net FAAC receipts rose 67% in naira terms after the subsidy removal, a real fall of 15% once its inflation is taken into account [3].
Presidential winner: PDP (2015), PDP (2019), LP (2023). Highest average presidential vote share across the three elections: PDP (64%). Senate seats won in 2023: APC 2, PDP 1; held in October 2026: APC 2, PDP 1. Classified Leaning (2023 margin 29.3 points).
Ebonyi state profile
Ebonyi ranks 3 of 36 on the SysIN State Index, in the leading band. Its strongest result is in Civic Space (2 of 37) and its weakest in Investment & Enterprise (36 of 37). Headline inflation averaged 13.0% over the twelve months to September 2026 [2], and ACLED recorded 59 conflict deaths in 2025 (1.6 per 100,000 residents) [4]. Net FAAC receipts rose 189% in naira terms after the subsidy removal, a real gain of 40% once its inflation is taken into account [3].
Presidential winner: PDP (2015), PDP (2019), LP (2023). Highest average presidential vote share across the three elections: PDP (55%). Senate seats won in 2023: APC 3; held in October 2026: APC 3. Classified Stronghold (2023 margin 66.8 points).
Edo state profile
Edo ranks 13 of 36 on the SysIN State Index, in the strong band. Its strongest result is in Health Outcomes & Investment (2 of 36) and its weakest in Debt Safety (34 of 36). Headline inflation averaged 12.6% over the twelve months to September 2026 [2], and ACLED recorded 115 conflict deaths in 2025 (2.2 per 100,000 residents) [4]. Net FAAC receipts rose 114% in naira terms after the subsidy removal, a real gain of 5% once its inflation is taken into account [3].
Presidential winner: PDP (2015), PDP (2019), LP (2023). Highest average presidential vote share across the three elections: PDP (41%). Senate seats won in 2023: APC 2, LP 1; held in October 2026: APC 3. Classified Leaning (2023 margin 32.1 points).
Ekiti state profile
Ekiti ranks 20 of 36 on the SysIN State Index, in the middle band. Its strongest result is in Safety & Security (1 of 37) and its weakest in FAAC Windfall (30 of 37). Headline inflation averaged 16.0% over the twelve months to September 2026 [2], and ACLED recorded 2 conflict deaths in 2025 (0.0 per 100,000 residents) [4]. Net FAAC receipts rose 170% in naira terms after the subsidy removal, a real gain of 31% once its inflation is taken into account [3].
Presidential winner: PDP (2015), APC (2019), APC (2023). Highest average presidential vote share across the three elections: APC (54%). Senate seats won in 2023: APC 3; held in October 2026: APC 3. Classified Leaning (2023 margin 36.3 points).
Enugu state profile
Enugu ranks 7 of 36 on the SysIN State Index, in the leading band. Its strongest result is in Fiscal Self-Reliance (2 of 36) and its weakest in Cost of Living Pressure (36 of 37). Headline inflation averaged 17.8% over the twelve months to September 2026 [2], and ACLED recorded 63 conflict deaths in 2025 (1.1 per 100,000 residents) [4]. Net FAAC receipts rose 185% in naira terms after the subsidy removal, a real gain of 41% once its inflation is taken into account [3].
Presidential winner: PDP (2015), PDP (2019), LP (2023). Highest average presidential vote share across the three elections: PDP (61%). Senate seats won in 2023: PDP 1, LP 1; held in October 2026: APC 2, PDP 1. Classified Stronghold (2023 margin 90.5 points).
Federal Capital Territory state profile
The FCT is not ranked on the SysIN State Index because 2024 state-finance data are not available for it [1]. Its strongest result is in Financial Access (1 of 37) and its weakest in Civic Space (36 of 37). Headline inflation averaged 15.3% over the twelve months to September 2026 [2], and ACLED recorded 67 conflict deaths in 2025 (1.5 per 100,000 residents) [4]. Net FAAC receipts rose 206% in naira terms after the subsidy removal, a real gain of 47% once its inflation is taken into account [3].
Presidential winner: PDP (2015), PDP (2019), LP (2023). Highest average presidential vote share across the three elections: PDP (43%). Senate seats won in 2023: LP 1; held in October 2026: ADC 1. Classified Stronghold (2023 margin 41.5 points).
Gombe state profile
Gombe ranks 8 of 36 on the SysIN State Index, in the strong band. Its strongest result is in Investment & Enterprise (5 of 37) and its weakest in Fiscal Self-Reliance (31 of 36). Headline inflation averaged 14.8% over the twelve months to September 2026 [2], and ACLED recorded 16 conflict deaths in 2025 (0.4 per 100,000 residents) [4]. Net FAAC receipts rose 219% in naira terms after the subsidy removal, a real gain of 56% once its inflation is taken into account [3].
Presidential winner: APC (2015), APC (2019), PDP (2023). Highest average presidential vote share across the three elections: APC (60%). Senate seats won in 2023: APC 1, PDP 2; held in October 2026: PDP 2, APC 1. Classified Leaning (2023 margin 33.8 points).
Imo state profile
Imo ranks 18 of 36 on the SysIN State Index, in the middle band. Its strongest result is in Civic Space (3 of 37) and its weakest in Investment & Enterprise (37 of 37). Headline inflation averaged 15.8% over the twelve months to September 2026 [2], and ACLED recorded 141 conflict deaths in 2025 (2.0 per 100,000 residents) [4]. Net FAAC receipts rose 216% in naira terms after the subsidy removal, a real gain of 59% once its inflation is taken into account [3].
Presidential winner: PDP (2015), PDP (2019), LP (2023). Highest average presidential vote share across the three elections: PDP (51%). Senate seats won in 2023: APC 2, LP 1; held in October 2026: APC 3. Classified Stronghold (2023 margin 62.9 points).
Jigawa state profile
Jigawa ranks 2 of 36 on the SysIN State Index, in the leading band. Its strongest result is in Kidnapping Risk (2 of 37) and its weakest in Financial Access (35 of 37). Headline inflation averaged 12.3% over the twelve months to September 2026 [2], and ACLED recorded 25 conflict deaths in 2025 (0.3 per 100,000 residents) [4]. Net FAAC receipts rose 186% in naira terms after the subsidy removal, a real gain of 38% once its inflation is taken into account [3].
Presidential winner: APC (2015), APC (2019), APC (2023). Highest average presidential vote share across the three elections: APC (68%). Senate seats won in 2023: APC 2, PDP 1; held in October 2026: APC 2, PDP 1. Classified Swing (2023 margin 3.8 points).
Kaduna state profile
Kaduna ranks 31 of 36 on the SysIN State Index, in the critical band. Its strongest result is in Financial Access (5 of 37) and its weakest in Debt Safety (36 of 36). Headline inflation averaged 13.3% over the twelve months to September 2026 [2], and ACLED recorded 324 conflict deaths in 2025 (3.1 per 100,000 residents) [4]. Net FAAC receipts rose 167% in naira terms after the subsidy removal, a real gain of 28% once its inflation is taken into account [3].
Presidential winner: APC (2015), APC (2019), PDP (2023). Highest average presidential vote share across the three elections: APC (53%). Senate seats won in 2023: PDP 3; held in October 2026: PDP 1, ADC 1, APC 1. Classified Competitive (2023 margin 11.4 points).
Kano state profile
Kano ranks 11 of 36 on the SysIN State Index, in the strong band. Its strongest result is in Civilian Protection (6 of 37) and its weakest in Health Outcomes & Investment (30 of 36). Headline inflation averaged 13.8% over the twelve months to September 2026 [2], and ACLED recorded 94 conflict deaths in 2025 (0.6 per 100,000 residents) [4]. Net FAAC receipts rose 199% in naira terms after the subsidy removal, a real gain of 44% once its inflation is taken into account [3].
Presidential winner: APC (2015), APC (2019), NNPP (2023). Highest average presidential vote share across the three elections: APC (66%). Senate seats won in 2023: APC 1, NNPP 2; held in October 2026: APC 3. Classified Leaning (2023 margin 29.0 points).
Katsina state profile
Katsina ranks 30 of 36 on the SysIN State Index, in the critical band. Its strongest result is in Cost of Living Pressure (5 of 37) and its weakest in Kidnapping Risk (36 of 37). Headline inflation averaged 13.5% over the twelve months to September 2026 [2], and ACLED recorded 1,858 conflict deaths in 2025 (18.7 per 100,000 residents) [4]. Net FAAC receipts rose 205% in naira terms after the subsidy removal, a real gain of 58% once its inflation is taken into account [3].
Presidential winner: APC (2015), APC (2019), PDP (2023). Highest average presidential vote share across the three elections: APC (73%). Senate seats won in 2023: APC 3; held in October 2026: APC 3. Classified Swing (2023 margin 0.6 points).
Kebbi state profile
Kebbi ranks 20 of 36 on the SysIN State Index, in the middle band. Its strongest result is in Cost of Living Pressure (4 of 37) and its weakest in Fiscal Self-Reliance (35 of 36). Headline inflation averaged 12.3% over the twelve months to September 2026 [2], and ACLED recorded 324 conflict deaths in 2025 (5.7 per 100,000 residents) [4]. Net FAAC receipts rose 193% in naira terms after the subsidy removal, a real gain of 40% once its inflation is taken into account [3].
Presidential winner: APC (2015), APC (2019), PDP (2023). Highest average presidential vote share across the three elections: APC (68%). Senate seats won in 2023: PDP 2; held in October 2026: APC 1, PDP 1, ADC 1. Classified Competitive (2023 margin 6.6 points).
Kogi state profile
Kogi ranks 24 of 36 on the SysIN State Index, in the lagging band. Its strongest result is in Civic Space (11 of 37) and its weakest in Spending Priorities (32 of 36). Headline inflation averaged 14.7% over the twelve months to September 2026 [2], and ACLED recorded 150 conflict deaths in 2025 (2.6 per 100,000 residents) [4]. Net FAAC receipts rose 216% in naira terms after the subsidy removal, a real gain of 47% once its inflation is taken into account [3].
Presidential winner: APC (2015), APC (2019), APC (2023). Highest average presidential vote share across the three elections: APC (57%). Senate seats won in 2023: APC 3; held in October 2026: APC 2, PDP 1. Classified Leaning (2023 margin 20.9 points).
Kwara state profile
Kwara ranks 29 of 36 on the SysIN State Index, in the critical band. Its strongest result is in FAAC Windfall (3 of 37) and its weakest in Cost of Living Pressure (34 of 37). Headline inflation averaged 16.6% over the twelve months to September 2026 [2], and ACLED recorded 488 conflict deaths in 2025 (12.0 per 100,000 residents) [4]. Net FAAC receipts rose 239% in naira terms after the subsidy removal, a real gain of 65% once its inflation is taken into account [3].
Presidential winner: APC (2015), APC (2019), APC (2023). Highest average presidential vote share across the three elections: APC (64%). Senate seats won in 2023: APC 3; held in October 2026: APC 2, PDP 1. Classified Leaning (2023 margin 26.9 points).
Lagos state profile
Lagos ranks 18 of 36 on the SysIN State Index, in the middle band. Its strongest result is in Investment & Enterprise (1 of 37) and its weakest in Debt Safety (35 of 36). Headline inflation averaged 17.3% over the twelve months to September 2026 [2], and ACLED recorded 102 conflict deaths in 2025 (0.6 per 100,000 residents) [4]. Net FAAC receipts rose 317% in naira terms after the subsidy removal, a real gain of 94% once its inflation is taken into account [3].
Presidential winner: APC (2015), APC (2019), LP (2023). Highest average presidential vote share across the three elections: APC (51%). Senate seats won in 2023: APC 3; held in October 2026: APC 3. Classified Swing (2023 margin 0.8 points).
Nasarawa state profile
Nasarawa ranks 10 of 36 on the SysIN State Index, in the strong band. Its strongest result is in FAAC Windfall (2 of 37) and its weakest in Civilian Protection (31 of 37). Headline inflation averaged 13.9% over the twelve months to September 2026 [2], and ACLED recorded 99 conflict deaths in 2025 (3.1 per 100,000 residents) [4]. Net FAAC receipts rose 200% in naira terms after the subsidy removal, a real gain of 52% once its inflation is taken into account [3].
Presidential winner: PDP (2015), APC (2019), LP (2023). Highest average presidential vote share across the three elections: PDP (43%). Senate seats won in 2023: PDP 1, SDP 2; held in October 2026: APC 1, ADC 1, SDP 1. Classified Swing (2023 margin 3.4 points).
Niger state profile
Niger ranks 33 of 36 on the SysIN State Index, in the critical band. Its strongest result is in Investment & Enterprise (9 of 37) and its weakest in Civic Space (37 of 37). Headline inflation averaged 14.9% over the twelve months to September 2026 [2], and ACLED recorded 1,504 conflict deaths in 2025 (20.6 per 100,000 residents) [4]. Net FAAC receipts rose 211% in naira terms after the subsidy removal, a real gain of 50% once its inflation is taken into account [3].
Presidential winner: APC (2015), APC (2019), APC (2023). Highest average presidential vote share across the three elections: APC (67%). Senate seats won in 2023: APC 2, PDP 1; held in October 2026: APC 2, PDP 1. Classified Competitive (2023 margin 11.6 points).
Ogun state profile
Ogun ranks 16 of 36 on the SysIN State Index, in the middle band. Its strongest result is in Investment & Enterprise (2 of 37) and its weakest in Spending Priorities (35 of 36). Headline inflation averaged 14.8% over the twelve months to September 2026 [2], and ACLED recorded 37 conflict deaths in 2025 (0.5 per 100,000 residents) [4]. Net FAAC receipts rose 235% in naira terms after the subsidy removal, a real gain of 64% once its inflation is taken into account [3].
Presidential winner: APC (2015), APC (2019), APC (2023). Highest average presidential vote share across the three elections: APC (56%). Senate seats won in 2023: APC 3; held in October 2026: APC 3. Classified Leaning (2023 margin 37.5 points).
Ondo state profile
Ondo ranks 26 of 36 on the SysIN State Index, in the lagging band. Its strongest result is in Financial Access (12 of 37) and its weakest in Spending Priorities (33 of 36). Headline inflation averaged 16.3% over the twelve months to September 2026 [2], and ACLED recorded 64 conflict deaths in 2025 (1.1 per 100,000 residents) [4]. Net FAAC receipts rose 155% in naira terms after the subsidy removal, a real gain of 24% once its inflation is taken into account [3].
Presidential winner: APC (2015), PDP (2019), APC (2023). Highest average presidential vote share across the three elections: APC (55%). Senate seats won in 2023: APC 3; held in October 2026: APC 3. Classified Swing (2023 margin 46.2 points).
Osun state profile
Osun ranks 22 of 36 on the SysIN State Index, in the lagging band. Its strongest result is in Kidnapping Risk (1 of 37) and its weakest in Learning Outcomes (35 of 37). Headline inflation averaged 14.7% over the twelve months to September 2026 [2], and ACLED recorded 33 conflict deaths in 2025 (0.5 per 100,000 residents) [4]. Net FAAC receipts rose 252% in naira terms after the subsidy removal, a real gain of 70% once its inflation is taken into account [3].
Presidential winner: APC (2015), APC (2019), PDP (2023). Highest average presidential vote share across the three elections: APC (52%). Senate seats won in 2023: PDP 3; held in October 2026: PDP 2, APC 1. Classified Swing (2023 margin 1.4 points).
Oyo state profile
Oyo ranks 17 of 36 on the SysIN State Index, in the middle band. Its strongest result is in Safety & Security (2 of 37) and its weakest in Spending Priorities (28 of 36). Headline inflation averaged 13.9% over the twelve months to September 2026 [2], and ACLED recorded 21 conflict deaths in 2025 (0.2 per 100,000 residents) [4]. Net FAAC receipts rose 223% in naira terms after the subsidy removal, a real gain of 51% once its inflation is taken into account [3].
Presidential winner: APC (2015), PDP (2019), APC (2023). Highest average presidential vote share across the three elections: APC (53%). Senate seats won in 2023: APC 3; held in October 2026: APC 3. Classified Swing (2023 margin 33.0 points).
Plateau state profile
Plateau ranks 32 of 36 on the SysIN State Index, in the critical band. Its strongest result is in FAAC Windfall (4 of 37) and its weakest in Spending Priorities (36 of 36). Headline inflation averaged 13.5% over the twelve months to September 2026 [2], and ACLED recorded 675 conflict deaths in 2025 (12.9 per 100,000 residents) [4]. Net FAAC receipts rose 253% in naira terms after the subsidy removal, a real gain of 75% once its inflation is taken into account [3].
Presidential winner: PDP (2015), PDP (2019), LP (2023). Highest average presidential vote share across the three elections: PDP (44%). Senate seats won in 2023: PDP 2; held in October 2026: APC 2, ADC 1. Classified Competitive (2023 margin 14.6 points).
Rivers state profile
Rivers ranks 6 of 36 on the SysIN State Index, in the leading band. Its strongest result is in Learning Outcomes (1 of 37) and its weakest in FAAC Windfall (37 of 37). Headline inflation averaged 16.7% over the twelve months to September 2026 [2], and ACLED recorded 60 conflict deaths in 2025 (0.6 per 100,000 residents) [4]. Net FAAC receipts rose 86% in naira terms after the subsidy removal, a real fall of 11% once its inflation is taken into account [3].
Presidential winner: PDP (2015), PDP (2019), APC (2023). Highest average presidential vote share across the three elections: PDP (62%). Senate seats won in 2023: PDP 3; held in October 2026: APC 2, PDP 1. Classified Competitive (2023 margin 10.8 points).
Sokoto state profile
Sokoto ranks 35 of 36 on the SysIN State Index, in the critical band. Its strongest result is in FAAC Windfall (12 of 37) and its weakest in Health Outcomes & Investment (36 of 36). Headline inflation averaged 16.1% over the twelve months to September 2026 [2], and ACLED recorded 914 conflict deaths in 2025 (14.4 per 100,000 residents) [4]. Net FAAC receipts rose 222% in naira terms after the subsidy removal, a real gain of 58% once its inflation is taken into account [3].
Presidential winner: APC (2015), APC (2019), PDP (2023). Highest average presidential vote share across the three elections: APC (62%). Senate seats won in 2023: not recorded in source; held in October 2026: ADC 2, APC 1. Classified Swing (2023 margin 0.5 points).
Taraba state profile
Taraba ranks 5 of 36 on the SysIN State Index, in the leading band. Its strongest result is in Cost of Living Pressure (1 of 37) and its weakest in Fiscal Self-Reliance (32 of 36). Headline inflation averaged 13.3% over the twelve months to September 2026 [2], and ACLED recorded 146 conflict deaths in 2025 (3.8 per 100,000 residents) [4]. Net FAAC receipts rose 228% in naira terms after the subsidy removal, a real gain of 68% once its inflation is taken into account [3].
Presidential winner: PDP (2015), PDP (2019), PDP (2023). Highest average presidential vote share across the three elections: PDP (48%). Senate seats won in 2023: APC 1, PDP 2; held in October 2026: APC 3. Classified Competitive (2023 margin 8.6 points).
Yobe state profile
Yobe ranks 23 of 36 on the SysIN State Index, in the lagging band. Its strongest result is in Debt Safety (2 of 36) and its weakest in Fiscal Self-Reliance (36 of 36). Headline inflation averaged 17.9% over the twelve months to September 2026 [2], and ACLED recorded 256 conflict deaths in 2025 (5.9 per 100,000 residents) [4]. Net FAAC receipts rose 206% in naira terms after the subsidy removal, a real gain of 50% once its inflation is taken into account [3].
Presidential winner: APC (2015), APC (2019), PDP (2023). Highest average presidential vote share across the three elections: APC (74%). Senate seats won in 2023: APC 2; held in October 2026: APC 3. Classified Competitive (2023 margin 12.4 points).
Zamfara state profile
Zamfara ranks 36 of 36 on the SysIN State Index, in the critical band. Its strongest result is in Debt Safety (4 of 36) and its weakest in Cost of Living Pressure (37 of 37). Headline inflation averaged 18.1% over the twelve months to September 2026 [2], and ACLED recorded 2,759 conflict deaths in 2025 (47.3 per 100,000 residents) [4]. Net FAAC receipts rose 228% in naira terms after the subsidy removal, a real gain of 58% once its inflation is taken into account [3].
Presidential winner: APC (2015), APC (2019), APC (2023). Highest average presidential vote share across the three elections: APC (72%). Senate seats won in 2023: APC 2; held in October 2026: APC 3. Classified Leaning (2023 margin 20.8 points).
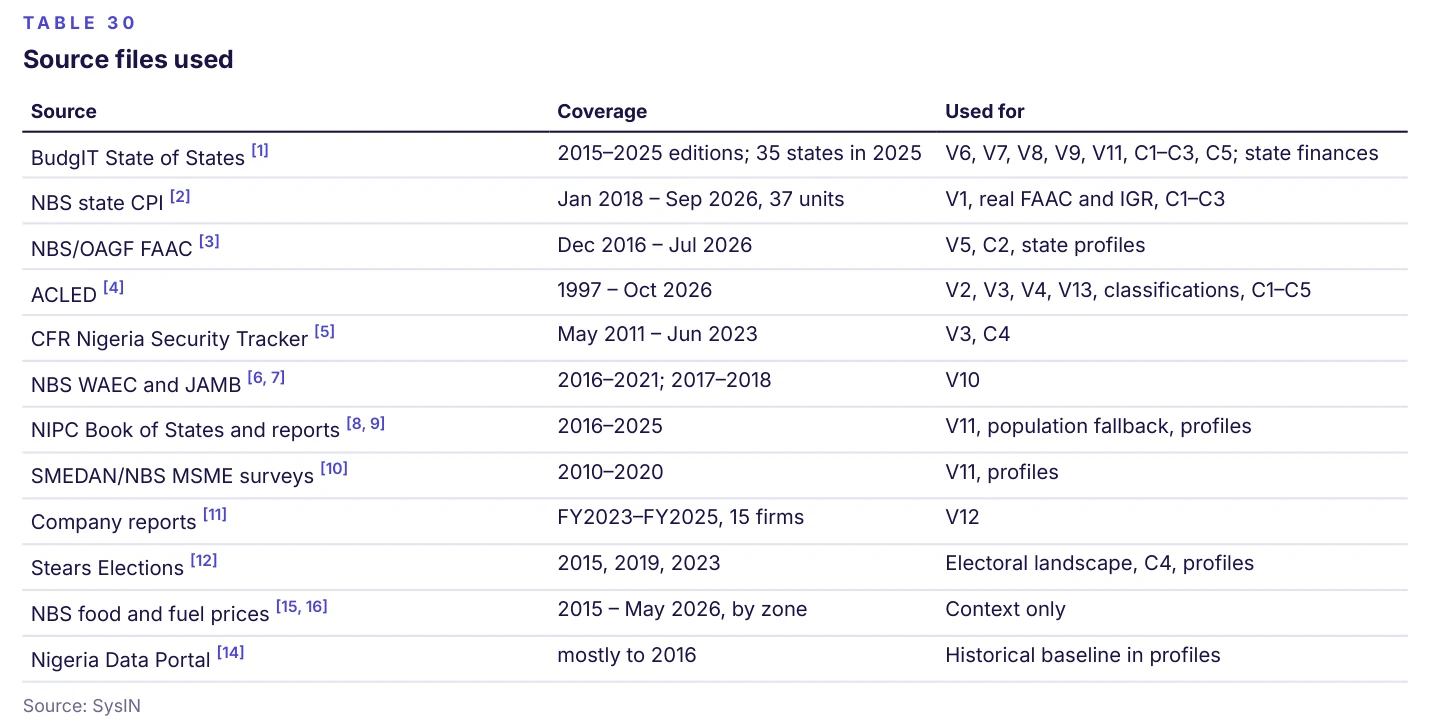
21.1 Unit of analysis and population
The report covers the 36 states and the Federal Capital Territory (37 units). The FCT is a federal territory administered by a minister; BudgIT does not report its finances, so it is not ranked in verticals that depend on BudgIT data. Perperson rates use one population base for all indicators: the 2024 population implied by BudgIT's 2025 edition (IGR 2024 divided by IGR per person 2024) [1]. Rivers, which is absent from that edition, uses the population implied by BudgIT's 2024 edition (IGR 2023 divided by IGR per person 2023). For the FCT, the NIPC 2017 estimate [8] is multiplied by the median ratio between the BudgIT 2024 figure and the 2017 estimate across the other states (1.277). The resulting national total is 248 million.
21.2 Periods
Each indicator uses the latest period available for all or nearly all states, and the same period for every state. A state that lacks data for that period is shown as missing, with one documented exception: Rivers (21.3).
21.3 The Rivers exception
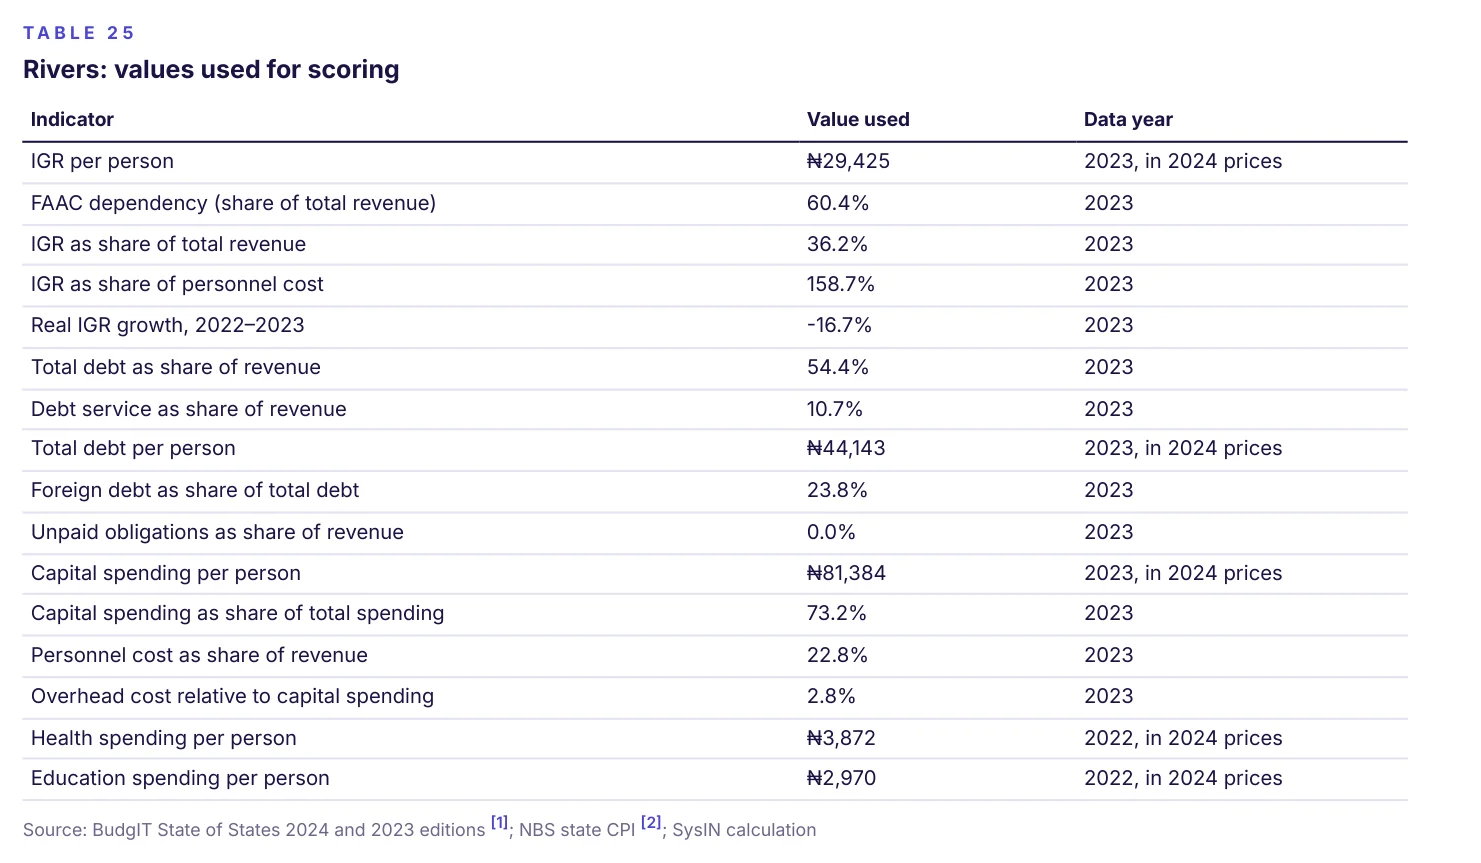
Rivers State is absent from BudgIT's 2025 edition (2024 data), which supplies the three fiscal verticals. Leaving it out would remove it from the SysIN State Index and the Investability Index, which together carry most of the report's weight. Rivers is therefore scored on the latest state finances available for it: its 2023 accounts from BudgIT's 2024 edition [1]. Ratios (such as FAAC dependency, debt service as a share of revenue, or capital spending as a share of total spending) are used as reported. Naira amounts per person (IGR, capital spending and debt per person) are converted to 2024 prices using Rivers' own consumer price index (factor 1.340) [2]. Real IGR growth uses 2022–2023 deflated by Rivers' 2023 inflation. Health and education spending per person are not reported for 2023, so the 2022 figures (BudgIT 2023 edition) are used, converted to 2024 prices (factor 1.708). Budget delivery for health and education is not available, so Spending Priorities is scored on 90% of its weight. Rivers is marked † wherever these figures are used: Fiscal Self-Reliance, Debt Safety, Spending Priorities, Health, the SysIN State Index, the Investability Index and Value for the Windfall. Its results should be read as indicative, as its data are one year older than other states'.
21.4 Scoring formulas
Capping. For indicator x across ranked states: x′ = min(max(x, P5), P95), where P5 and P95 are the 5th and 95th percentiles (linear interpolation).
Rescaling. Higher is better: s 100 (x′ − min) ÷ (max − min). Lower is better: s 100 (max − x′) ÷ (max − min).
Vertical score. V = Σ wi si ÷ Σ wi, summed over indicators with data. If the available weights total less than two thirds, the state is not ranked (NR).
Rank and band. Rank 1 highest score; equal scores (to one decimal) share a rank. Band Leading, Strong, Middle, Lagging or Critical according to the quintile of rank ÷ number of ranked states.
Robustness. Each vertical is recomputed with equal indicator weights; a state whose rank changes by more than five places is flagged as rank-sensitive (Appendix A).
21.5 Data treatment
Inflation. All cost-of-living indicators use rates of change, because NBS advises that state CPI levels are not comparable across states [2].
NBS rebased the CPI in January 2025 (2024 100). To measure the cumulative price rise since May 2023, SysIN rescales each state's pre2025 index so that its 2024 average equals 100, joining the two series. As a check, chaining NBS's published year-on-year and month-onmonth rates instead gives a median rise of about 96% (rather than 100%), with the same states at the extremes; the cumulative indicator carries 25% of one vertical's weight. NBS did not publish January 2025 state tables; that month is excluded from rate calculations. Bauchi's food series for January 2019 – October 2024 replicates Anambra's headline series and its November–December 2024 rows are shifted in the source; these months fall outside the twelve-month window, and Bauchi's 2024 average uses January–October only. Other table inconsistencies flagged in the source (February and April 2026 year-ago indices for some states; Katsina, November 2025) are used as published.
FAAC. Net and gross allocations to state governments by month of disbursement [3]. Real values divide each month's receipts by the state's joined CPI. October 2024 is missing in the source and falls outside the comparison windows. Gross figures for the FCT are not published for the latest window, so its deduction share is missing.
BudgIT. Values from the 2025 edition (2024 data) [1]. The edition's “Debt as % of Revenue" field duplicates its debt-service ratio, so SysIN computes debt ÷ revenue directly from total debt at 31 December 2024 and total revenue for 2024. Unpaid obligations (contractor arrears, pension and gratuity arrears and other liabilities) are computed only where all three items are reported. Rivers uses its 2023 figures from the 2024 edition, as described in 21.3.
Conflict. ACLED aggregated data summed to state and year [4]. Violent events are battles, explosions and remote violence, violence against civilians and riots. Persistence is the number of weeks in 2025 in which the state's most frequent type of violent event occurred, a lower bound on weeks with any violence. Offshore events labelled “South Atlantic Ocean" are excluded. The Nigeria Security Tracker [5] ends in June 2023 and is used only for long-run measures.
Education. WAEC pass rates pool private- and public-school candidates (2019–2021) or all school candidates (2016–2018) [6]. As the methodology requires, three 2020 public-school values flagged as anomalous (Osun 4.8%, Bayelsa 10.2%, Kwara 10.9%) were tested: including them moved Bayelsa by 17 places, so they were excluded.
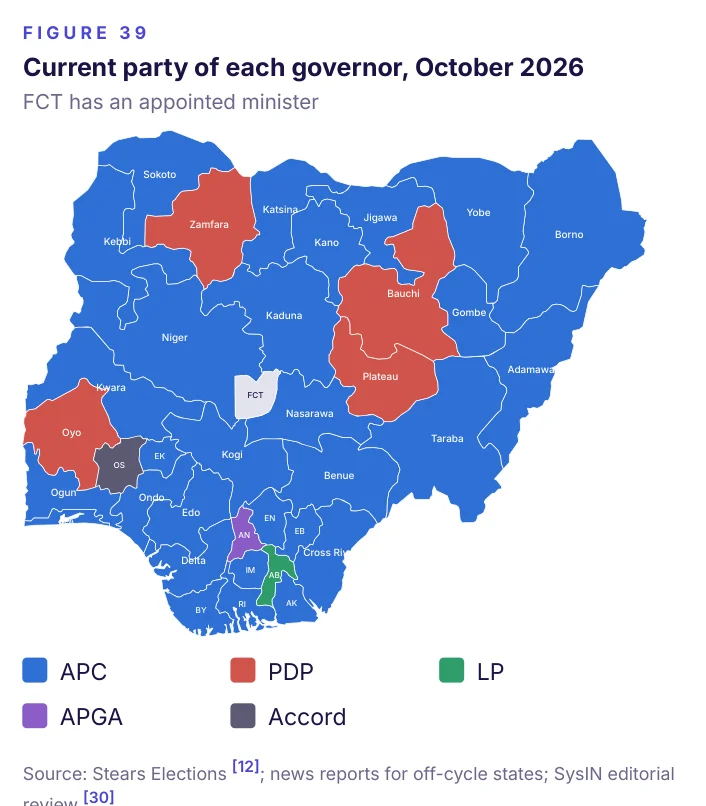
Elections. Results are taken from Stears Elections [12]; later court rulings, reruns and changes of party are not reflected. Governors of offcycle states are taken from published results reports (see References).
21.6 What the method cannot do
Rankings summarise; they do not explain causes. Conflict data are compiled from media reports and may under-count events in remote areas.
Several datasets are older than the report year and are labelled. The Financial Access vertical covers only the 15 firms that publish state-level branch lists. Composite weights reflect SysIN's judgement; the equal-weight test in Appendix A shows how sensitive each result is to that judgement.
21.10 Neutrality and review
Identical indicators, weights and periods apply to every state.
No ranking is grouped, averaged or labelled by political party. Election results are reported factually, with the party under which each office-holder was elected.
Every published figure was recomputed from the raw files by an independent check before release.
State governments may submit corrections or responses to SysIN; substantive responses will be published alongside future editions.
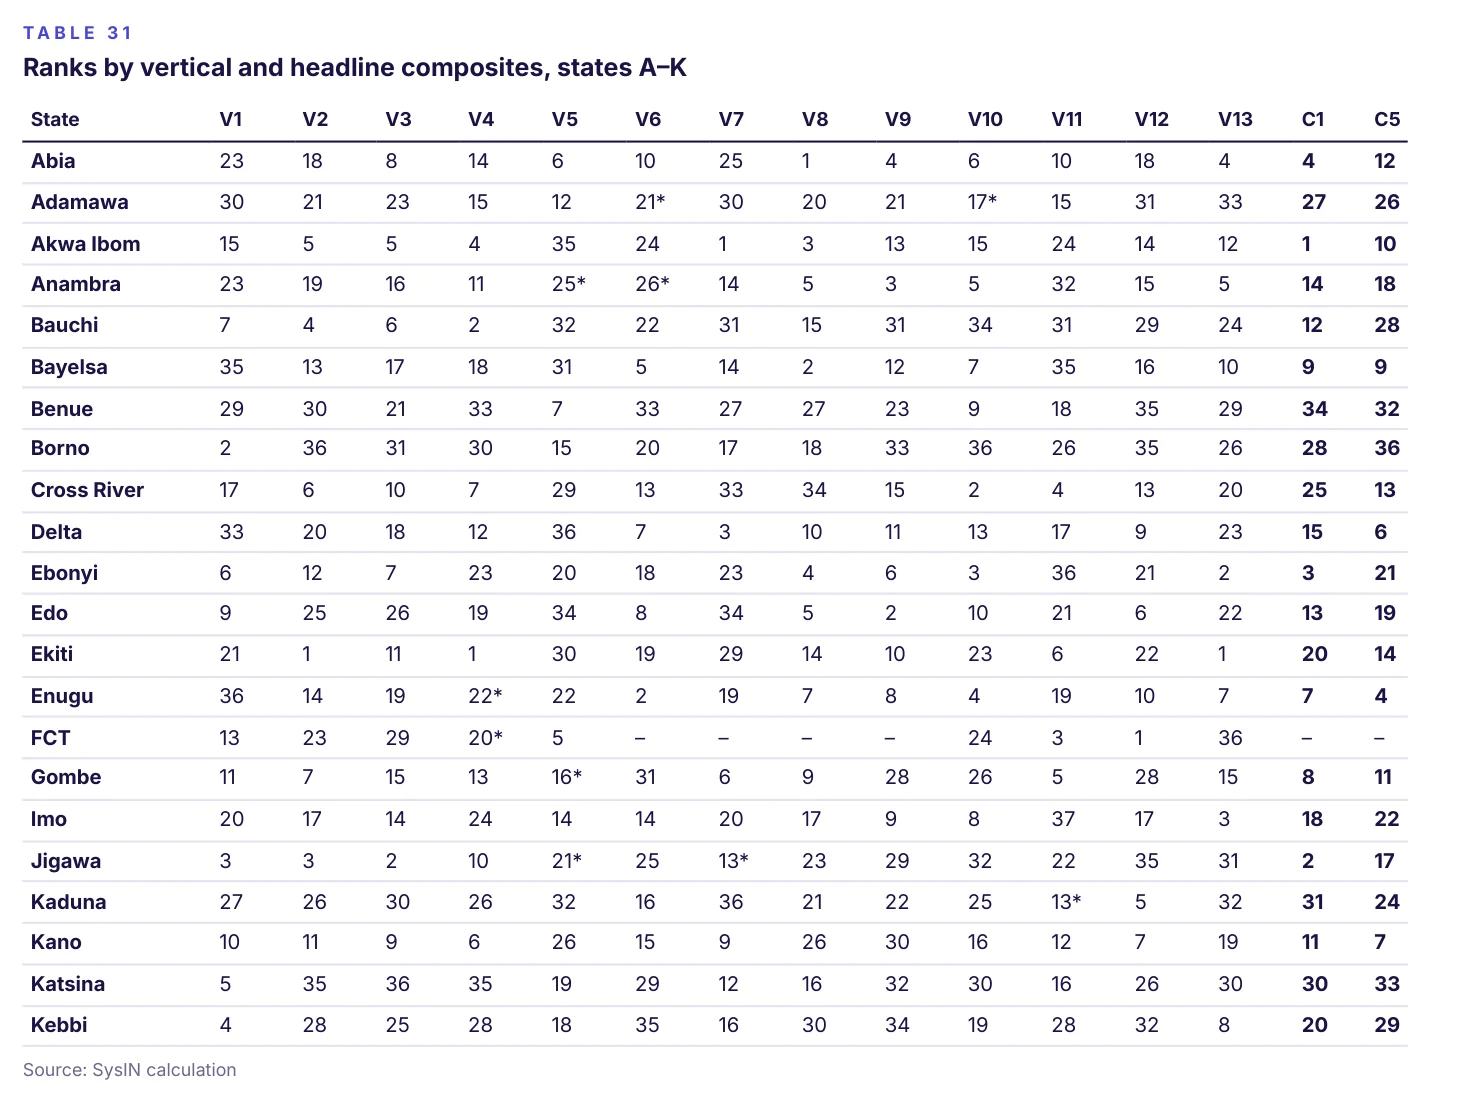
| State | V1 | V2 | V3 | V4 | V5 | V6 | V7 | V8 | V9 | V10 | V11 | V12 | V13 | C1 | C5 |
|---|---|---|---|---|---|---|---|---|---|---|---|---|---|---|---|
| Abia | 23 | 18 | 8 | 14 | 6 | 10 | 25 | 1 | 4 | 6 | 10 | 18 | 4 | 4 | 12 |
| Adamawa | 30 | 21 | 23 | 15 | 12 | 21* | 30 | 20 | 21 | 17* | 15 | 31 | 33 | 27 | 26 |
| Akwa Ibom | 15 | 5 | 5 | 4 | 35 | 24 | 1 | 3 | 13 | 15 | 24 | 14 | 12 | 1 | 10 |
| Anambra | 23 | 19 | 16 | 11 | 25* | 26* | 14 | 5 | 3 | 5 | 32 | 15 | 5 | 14 | 18 |
| Bauchi | 7 | 4 | 6 | 2 | 32 | 22 | 31 | 15 | 31 | 34 | 31 | 29 | 24 | 12 | 28 |
| Bayelsa | 35 | 13 | 17 | 18 | 31 | 5 | 14 | 2 | 12 | 7 | 35 | 16 | 10 | 9 | 9 |
| Benue | 29 | 30 | 21 | 33 | 7 | 33 | 27 | 27 | 23 | 9 | 18 | 35 | 29 | 34 | 32 |
| Borno | 2 | 36 | 31 | 30 | 15 | 20 | 17 | 18 | 33 | 36 | 26 | 35 | 26 | 28 | 36 |
| Cross River | 17 | 6 | 10 | 7 | 29 | 13 | 33 | 34 | 15 | 2 | 4 | 13 | 20 | 25 | 13 |
| Delta | 33 | 20 | 18 | 12 | 36 | 7 | 3 | 10 | 11 | 13 | 17 | 9 | 23 | 15 | 6 |
| Ebonyi | 6 | 12 | 7 | 23 | 20 | 18 | 23 | 4 | 6 | 3 | 36 | 21 | 2 | 3 | 21 |
| Edo | 9 | 25 | 26 | 19 | 34 | 8 | 34 | 5 | 2 | 10 | 21 | 6 | 22 | 13 | 19 |
| Ekiti | 21 | 1 | 11 | 1 | 30 | 19 | 29 | 14 | 10 | 23 | 6 | 22 | 1 | 20 | 14 |
| Enugu | 36 | 14 | 19 | 22* | 22 | 2 | 19 | 7 | 8 | 4 | 19 | 10 | 7 | 7 | 4 |
| FCT | 13 | 23 | 29 | 20* | 5 | – | – | – | – | 24 | 3 | 1 | 36 | – | – |
| Gombe | 11 | 7 | 15 | 13 | 16* | 31 | 6 | 9 | 28 | 26 | 5 | 28 | 15 | 8 | 11 |
| Imo | 20 | 17 | 14 | 24 | 14 | 14 | 20 | 17 | 9 | 8 | 37 | 17 | 3 | 18 | 22 |
| Jigawa | 3 | 3 | 2 | 10 | 21* | 25 | 13* | 23 | 29 | 32 | 22 | 35 | 31 | 2 | 17 |
| Kaduna | 27 | 26 | 30 | 26 | 32 | 16 | 36 | 21 | 22 | 25 | 13* | 5 | 32 | 31 | 24 |
| Kano | 10 | 11 | 9 | 6 | 26 | 15 | 9 | 26 | 30 | 16 | 12 | 7 | 19 | 11 | 7 |
| Katsina | 5 | 35 | 36 | 35 | 19 | 29 | 12 | 16 | 32 | 30 | 16 | 26 | 30 | 30 | 33 |
| Kebbi | 4 | 28 | 25 | 28 | 18 | 35 | 16 | 30 | 34 | 19 | 28 | 32 | 8 | 20 | 29 |
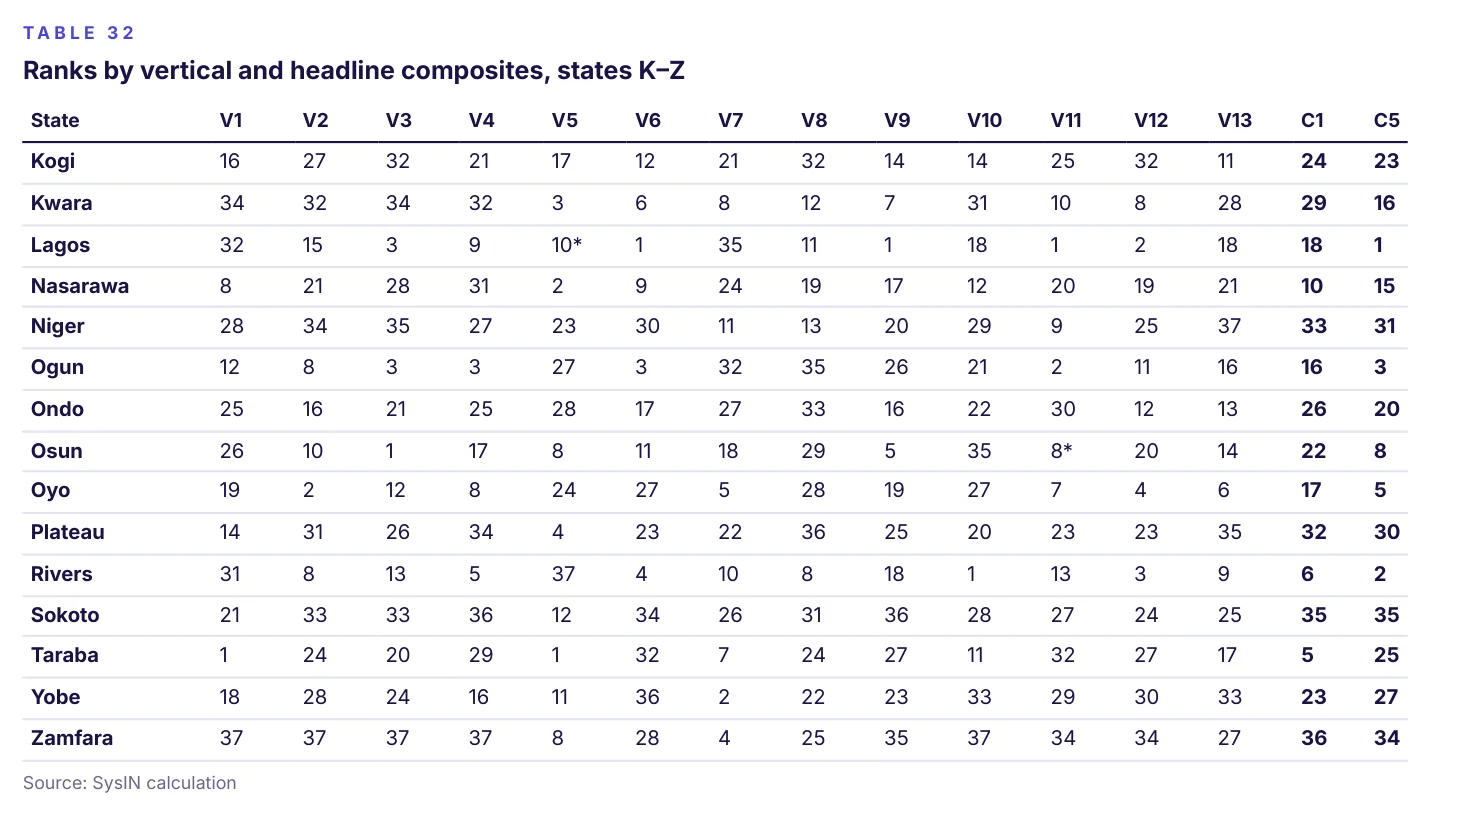
| State | V1 | V2 | V3 | V4 | V5 | V6 | V7 | V8 | V9 | V10 | V11 | V12 | V13 | C1 | C5 |
|---|---|---|---|---|---|---|---|---|---|---|---|---|---|---|---|
| Kogi | 16 | 27 | 32 | 21 | 17 | 12 | 21 | 32 | 14 | 14 | 25 | 32 | 11 | 24 | 23 |
| Kwara | 34 | 32 | 34 | 32 | 3 | 6 | 8 | 12 | 7 | 31 | 10 | 8 | 28 | 29 | 16 |
| Lagos | 32 | 15 | 3 | 9 | 10* | 1 | 35 | 11 | 1 | 18 | 1 | 2 | 18 | 18 | 1 |
| Nasarawa | 8 | 21 | 28 | 31 | 2 | 9 | 24 | 19 | 17 | 12 | 20 | 19 | 21 | 10 | 15 |
| Niger | 28 | 34 | 35 | 27 | 23 | 30 | 11 | 13 | 20 | 29 | 9 | 25 | 37 | 33 | 31 |
| Ogun | 12 | 8 | 3 | 3 | 27 | 3 | 32 | 35 | 26 | 21 | 2 | 11 | 16 | 16 | 3 |
| Ondo | 25 | 16 | 21 | 25 | 28 | 17 | 27 | 33 | 16 | 22 | 30 | 12 | 13 | 26 | 20 |
| Osun | 26 | 10 | 1 | 17 | 8 | 11 | 18 | 29 | 5 | 35 | 8* | 20 | 14 | 22 | 8 |
| Oyo | 19 | 2 | 12 | 8 | 24 | 27 | 5 | 28 | 19 | 27 | 7 | 4 | 6 | 17 | 5 |
| Plateau | 14 | 31 | 26 | 34 | 4 | 23 | 22 | 36 | 25 | 20 | 23 | 23 | 35 | 32 | 30 |
| Rivers | 31 | 8 | 13 | 5 | 37 | 4 | 10 | 8 | 18 | 1 | 13 | 3 | 9 | 6 | 2 |
| Sokoto | 21 | 33 | 33 | 36 | 12 | 34 | 26 | 31 | 36 | 28 | 27 | 24 | 25 | 35 | 35 |
| Taraba | 1 | 24 | 20 | 29 | 1 | 32 | 7 | 24 | 27 | 11 | 32 | 27 | 17 | 5 | 25 |
| Yobe | 18 | 28 | 24 | 16 | 11 | 36 | 2 | 22 | 23 | 33 | 29 | 30 | 33 | 23 | 27 |
| Zamfara | 37 | 37 | 37 | 37 | 8 | 28 | 4 | 25 | 35 | 37 | 34 | 34 | 27 | 36 | 34 |
References
[1] BudgIT Foundation. State of States, 2025 edition (fiscal data for 2024), and earlier editions 2015–2024. Lagos: BudgIT. https://budgit.org. Compiled by SysIN into a consolidated workbook, October 2026.
[2] National Bureau of Statistics (NBS). CPI and Inflation Report, monthly releases January 2019 – September 2026, Table 5 “Combined Urban and Rural State Consumer Price Index”. Abuja: NBS. https://nigerianstat.gov.ng/elibrary; NBS Microdata Catalog 154 (NGA- NBS-CPI).
[3] National Bureau of Statistics and Office of the Accountant-General of the Federation. Federation Account Allocation Committee (FAAC) monthly disbursement tables, December 2016 – July 2026. https://nigerianstat.gov.ng/elibrary; https://microdata.nigerianstat.gov.ng/index.php/catalog/156.
[4] Armed Conflict Location & Event Data (ACLED). Aggregated data export, Country = Nigeria, all event types, 1 January 1997 – 26 October 2026 (extracted 26 October 2026). https://acleddata.com. Used under the ACLED Terms of Use.
[5] Council on Foreign Relations, Africa Program. Nigeria Security Tracker, 29 May 2011 – 30 June 2023 (downloaded 26 October 2026). https://www.cfr.org/articles/nigeria-security-tracker. Licensed CC BY-NC-ND 4.0.
[6] National Bureau of Statistics. WAEC Results Statistics (2016–2018) and WAEC Results Statistics (2019–2021). Abuja: NBS e-Library. https://nigerianstat.gov.ng/elibrary.
[7] National Bureau of Statistics. JAMB Applications and Admitted Candidates by State and Gender within Faculty (2017–2018). Abuja: NBS. https://nigerianstat.gov.ng.
[8] Nigerian Investment Promotion Commission (NIPC) and Nigeria Governors’ Forum. Book of States (dated 31 August 2020; launched 12 April 2021). Abuja: NIPC. https://nipc.gov.ng.
[9] Nigerian Investment Promotion Commission. Reports of Activities 2016–2022/23 and Annual Reports 2024 and 2025. Abuja: NIPC. https://nipc.gov.ng.
[10] Small and Medium Enterprises Development Agency of Nigeria (SMEDAN) and National Bureau of Statistics. MSME National Survey, 2010, 2013, 2017 and 2020 rounds.
[11] Annual reports and investor publications of 15 listed financial-services companies (Jaiz Bank; Infinity Trust Mortgage Bank; AIICO, Cornerstone, Linkage, Mutual Benefits, Prestige, Regency Alliance, AXA Mansard, SUNU, International Energy, Coronation and African Alliance insurers; Africa Prudential; FirstBank insurance brokerage), FY2023–FY2025, compiled by SysIN.
[12] Stears Elections. Nigeria election results: presidential, governorship and senate results for 2015, 2019 and 2023 (based on INEC declarations). https://www.stears.co/elections/2023/president/ and corresponding 2015, 2019, governorship and senate pages (accessed 26 October 2026).
[13] Voice of Nigeria. “INEC issues revised timetable for 2027 general election”, 27 February 2026. https://von.gov.ng/inec-issues-revised-timetable-for-2027-general-election/
[14] Nigeria Data Portal (Knoema / NBS socio-economic statistics), state Atlas pages. https://nigeria.opendataforafrica.org (extracted 26 October 2026).
[15] National Bureau of Statistics. Selected Food Prices Watch, zonal average prices, January 2017 – May 2026. https://nigerianstat.gov.ng/elibrary.
[16] National Bureau of Statistics. Premium Motor Spirit (Petrol) Price Watch and Automotive Gas Oil (Diesel) Price Watch, zonal averages, 2015 – May 2026. https://nigerianstat.gov.ng/elibrary.
[17] TechCabal. “Meet Nigeria Macro Monitor, the platform mapping Nigeria’s economy in real time”. https://techcabal.com/?p=183860 (accessed 26 October 2026).
[18] Constitution of the Federal Republic of Nigeria 1999 (as amended), Section 162(2): not less than 13% of revenue accruing to the Federation Account from natural resources is allocated on the principle of derivation. Before the Ballot 2027
[19] Natural Earth. Admin 1 – States, Provinces (1:10m), version 5. Public domain. https://www.naturalearthdata.com. State boundaries simplified by SysIN for display.
[20] AllAfrica. “INEC declares Soludo winner of Anambra governorship election”, 9 November 2025. https://allafrica.com/stories/202511100066.html; AllAfrica, 18 March 2026. https://allafrica.com/stories/202603190344.html
[21] Channels Television. “Diri defeats Sylva, clinches second term as Bayelsa governor”, 13 November 2023. https://www.channelstv.com/2023/11/13/diri-defeats-sylva-clinches-second-term-as-bayelsa-gov/
[22] Channels Television. “INEC declares APC’s Okpebholo winner of Edo governorship election”, 22 September 2024; “Okpebholo sworn in as Edo State governor”, 12 November 2024. https://www.channelstv.com; ICIR. “Supreme Court affirms Okpebholo as Edo governor”, July 2025. https://www.icirnigeria.org/supreme-court-affirms-okpebholo-as-edo-governor/
[23] AllAfrica. Ekiti governorship election result, 22 June 2026. https://allafrica.com/stories/202606220724.html; Arise News. “Oyebanji thanks Tinubu, Ekiti residents after second-term inauguration”, 18 October 2026. https://www.arise.tv
[24] ICIR. “INEC declares APC Uzodimma winner of Imo State governorship election”, 12 November 2023; Channels Television. “Uzodimma sworn in for second term”, 15 January 2024. https://www.icirnigeria.org; https://www.channelstv.com
[25] ICIR. “INEC declares Ododo winner of Kogi poll”, 13 November 2023; ThisDay. “Ododo sworn in as Kogi gov”, 27 January 2024. https://www.icirnigeria.org; https://www.thisdaylive.com
[26] ThisDay. “Aiyedatiwa wins Ondo governorship election”, 17 November 2024; Channels Television. “Aiyedatiwa sworn in as Ondo State governor”, 24 February 2025. https://www.thisdaylive.com; https://www.channelstv.com
[27] News Agency of Nigeria. “INEC declares Adeleke winner of Osun governorship election”, 16 August 2026. https://nannews.ng/inec- declares-adeleke-winner-of-osun-governorship-election/; Legit.ng. “Osun governorship 2026: APC, PDP file petitions”, 7 September
[28] ICIR. “Fubara bounces back as Tinubu lifts emergency rule”, 17 September 2025. https://www.icirnigeria.org/breaking-fubara- bounces-back-as-tinubu-lifts-emergency-rule/; AllAfrica, 25 February 2026 and 23 July 2026. https://allafrica.com
[29] Voice of Nigeria. “FCT Minister sets stage for fresh FCT project commissioning”, 14 August 2026. https://von.gov.ng
[30] SysIN Editorial & Verification Review. Official Updates and Corrections for the Before the Ballot 2027 Report (memorandum), 28 October 2026. Current party affiliations, by-election results and omitted names for governors and senators.