The Power of the Few: Firm-Level Productivity in Nigeria 2026
A handful of large firms shape productivity in Nigeria’s formal economy, and most of the naira gains since 2019 reflect prices rather than output. The report applies a firm-by-firm lens to ten firms that disclose enough to be analysed.
Executive summary
Nigeria's productivity story is written by a handful of large firms, and in recent years mostly in the ink of prices rather than output.
≈0: Contribution of staff moving to more productive firms, among both the non-bank firms and the banks, 2024–25.
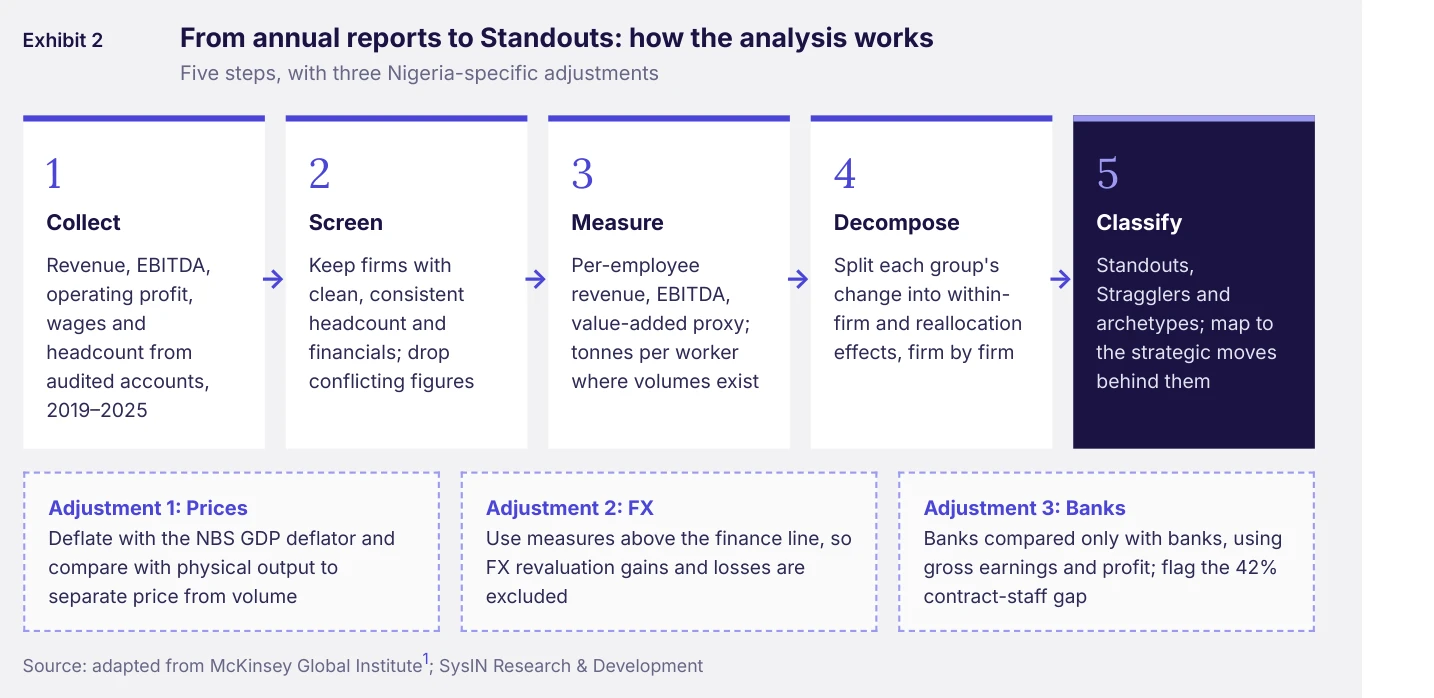
Productivity, the value each worker creates, is the only lasting source of higher wages, profits and living standards. McKinsey Global Institute's 2025 study The Power of One showed that in the United States, Germany and the United Kingdom, fewer than 100 "Standout" firms out of 8,300 generated about two-thirds of productivity growth[1]. This report asks the same question of Nigeria's formal economy using the only data available at firm level: audited company accounts.
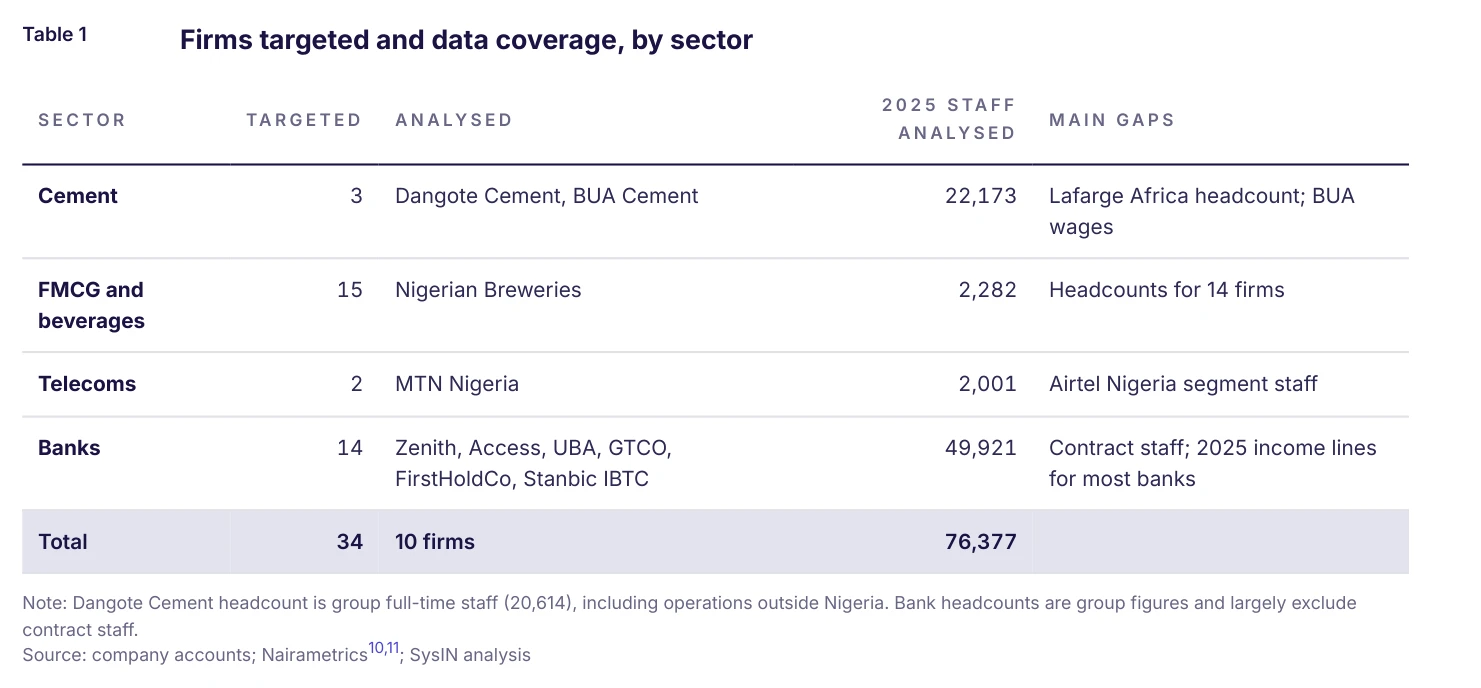
The resulting sample is small. Ten firms disclose clean headcounts and financials for 2024 and 2025: MTN Nigeria, Dangote Cement, BUA Cement, Nigerian Breweries and six large banks. They employ about 76,000 people. The findings are therefore indicative, not national estimates.
1. A few firms sit far ahead of the rest
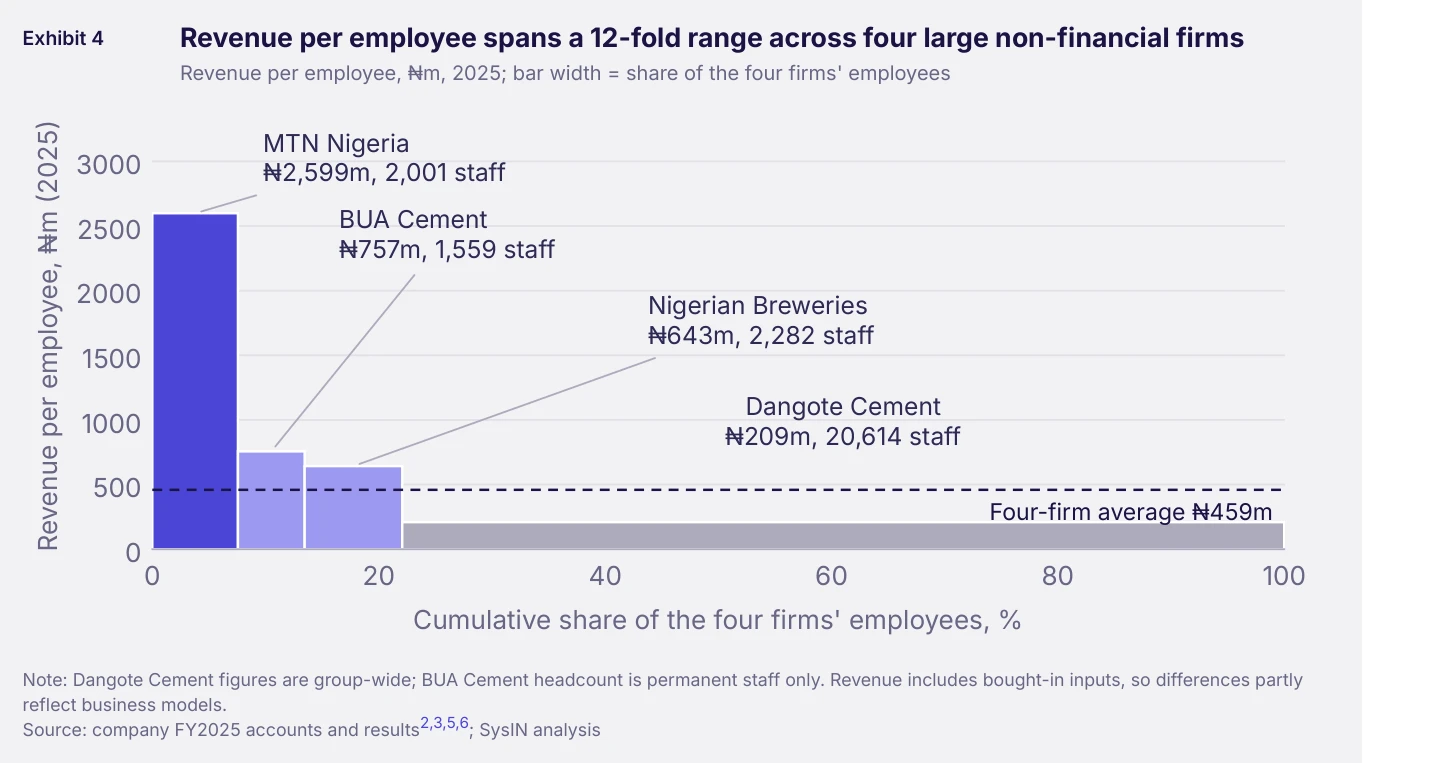
MTN Nigeria generated ₦2.60bn of revenue and ₦1.37bn of EBITDA per employee in 2025. That is 12 times Dangote Cement's revenue per employee and 3– 4 times BUA Cement's and Nigerian Breweries'.
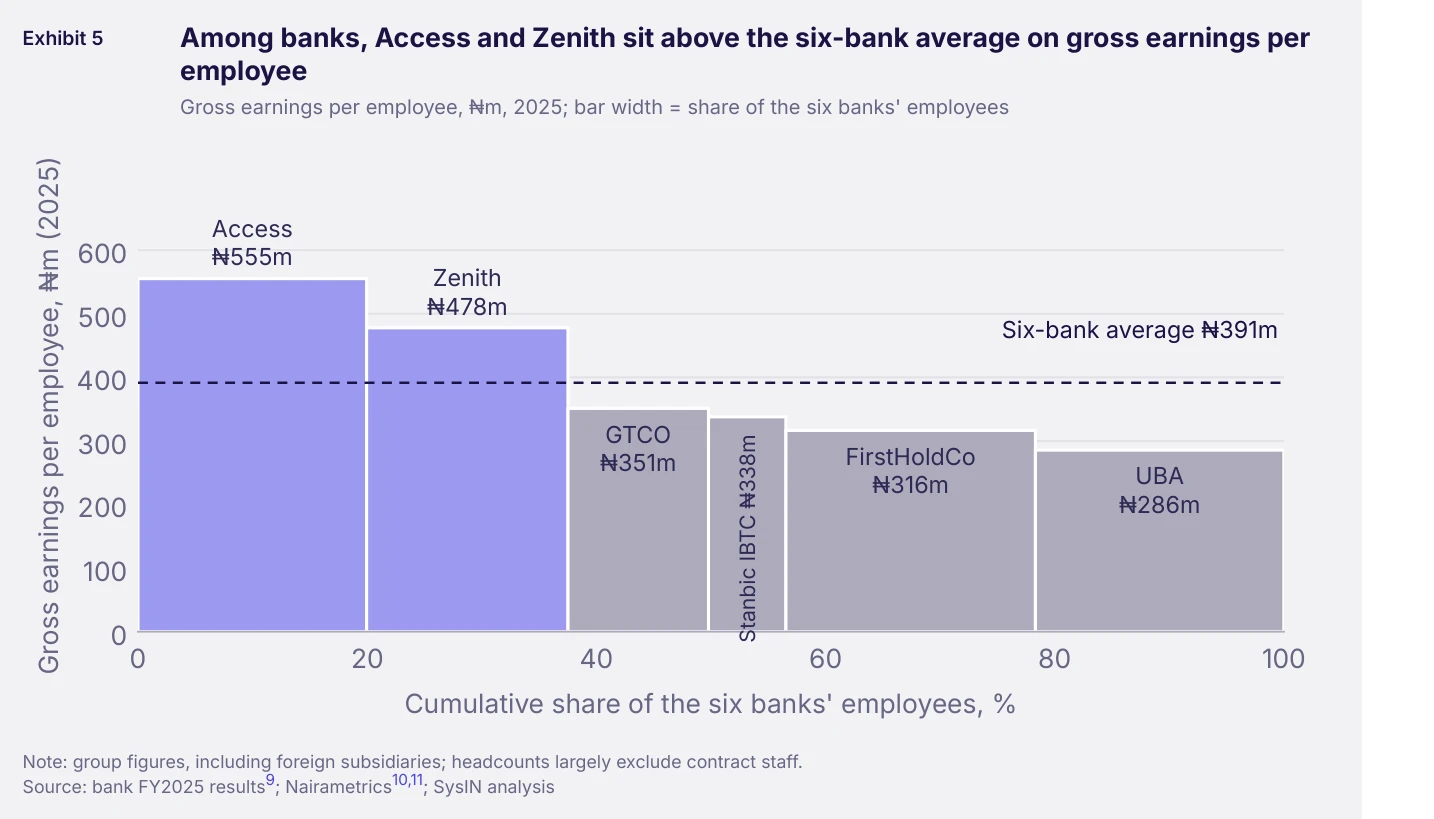
Among banks, gross earnings per employee range from ₦555m at Access to ₦286m at UBA.
2. Most naira gains since 2019 are price, not output
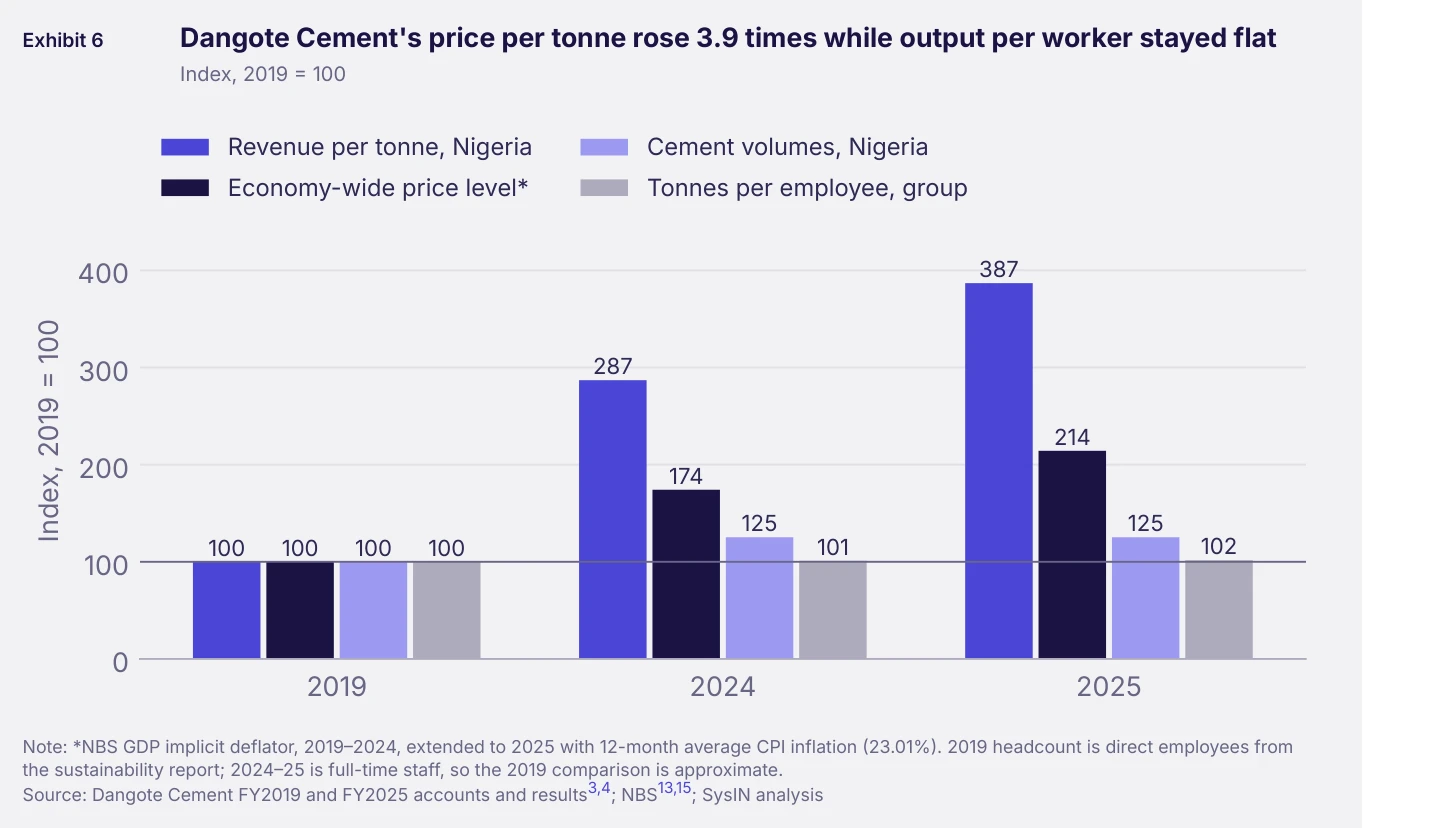
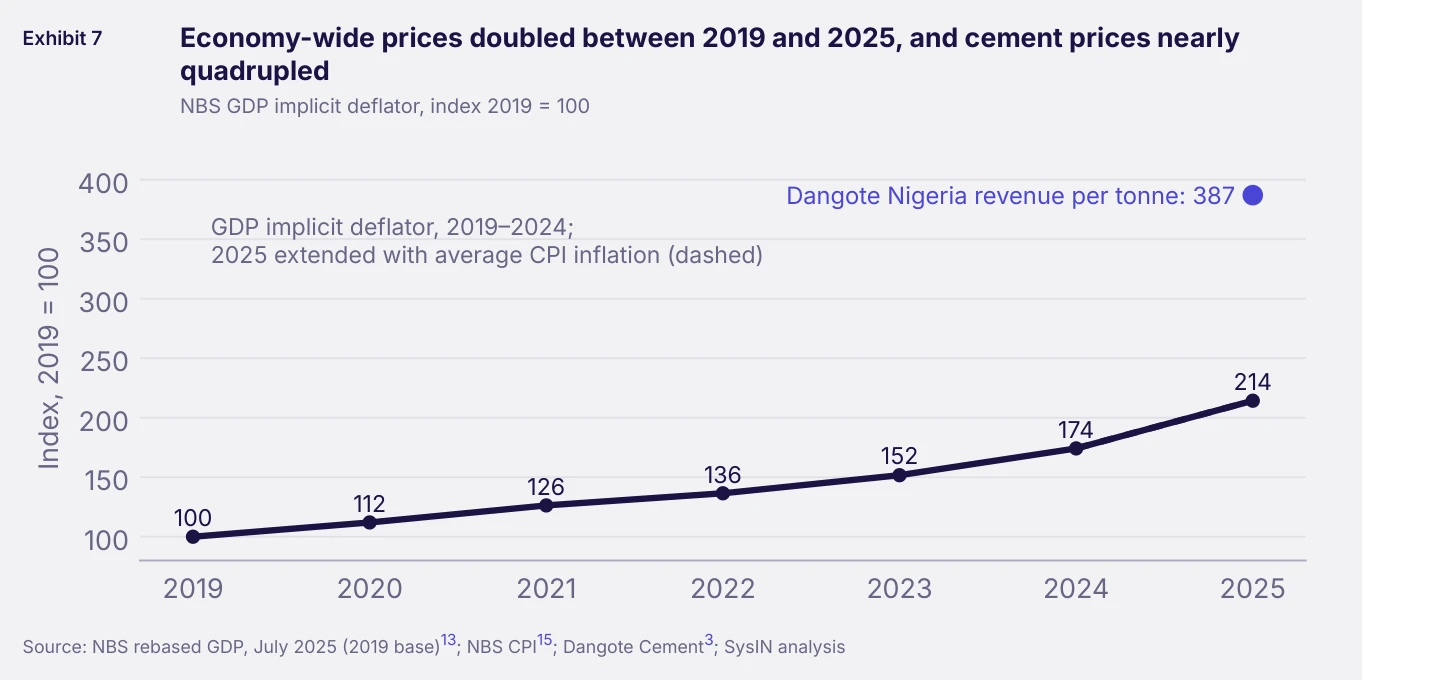
Dangote Cement's Nigerian revenue per tonne rose from ₦43,218 in 2019 to ₦167,185 in 2025, a 3.9-fold increase. Economy-wide prices rose 2.1 times.
Tonnes of cement per Dangote employee were about 1,310 in 2019 and 1,333 in 2025: physical productivity barely moved. In 2019 prices, revenue per employee was flat in 2025 (₦97.5m vs ₦98.3m in 2024).
3. FX swings dwarf operating performance
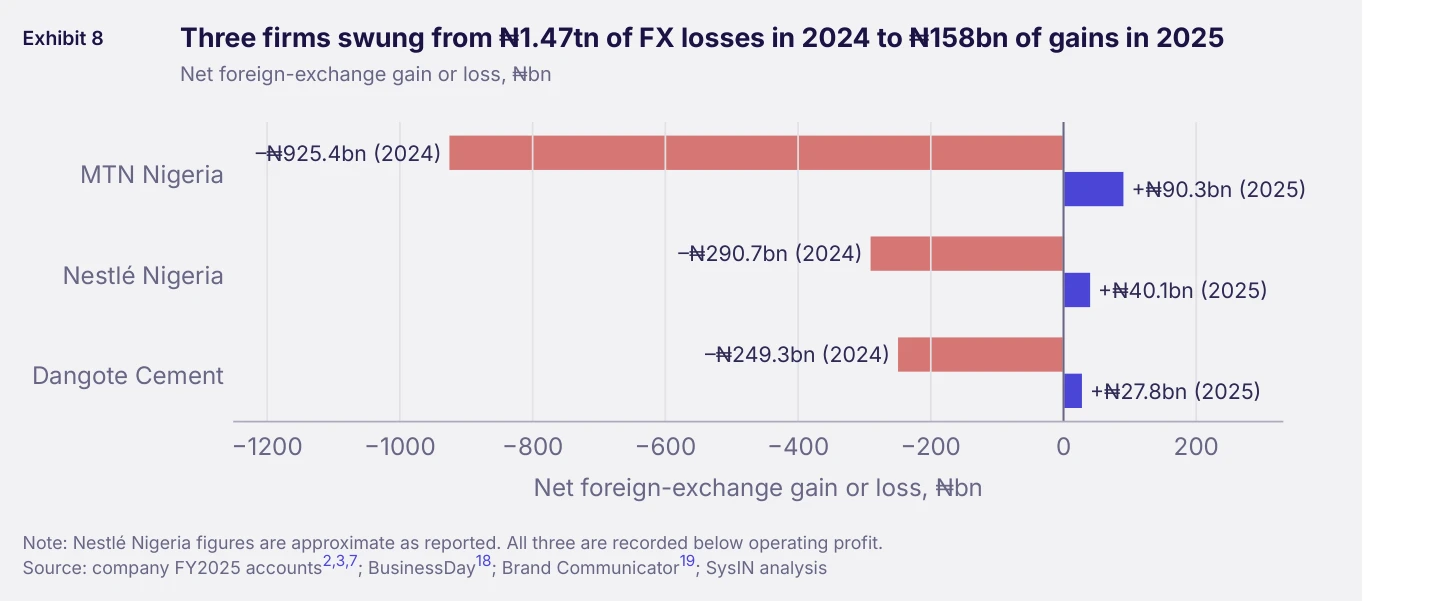
MTN Nigeria, Nestlé Nigeria and Dangote Cement booked ₦1.47tn of FX losses in 2024 and ₦158bn of gains in 2025. That is why this analysis uses revenue, EBITDA and operating profit, not net profit, for nonfinancial firms.
4. Two smaller firms punched far above their weight
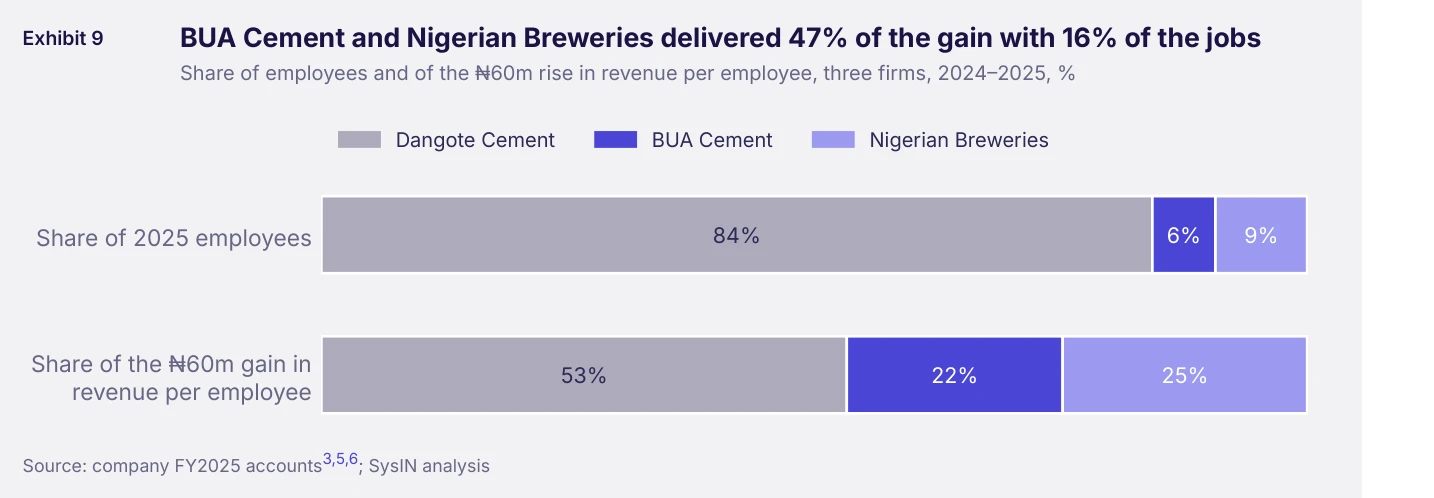
Revenue per employee across Dangote Cement, BUA Cement and Nigerian Breweries rose by ₦60m (+27%) in 2025. BUA (6% of jobs) delivered 22% of the gain and Nigerian Breweries (9%) 25%. Both are Standouts.
BUA's operating profit per employee rose 3.6 times as its operating margin went from 16.5% to 42.8%. Nigerian Breweries' rose 2.8 times after it cut breweries and debt.
5. Banks hired while profits fell
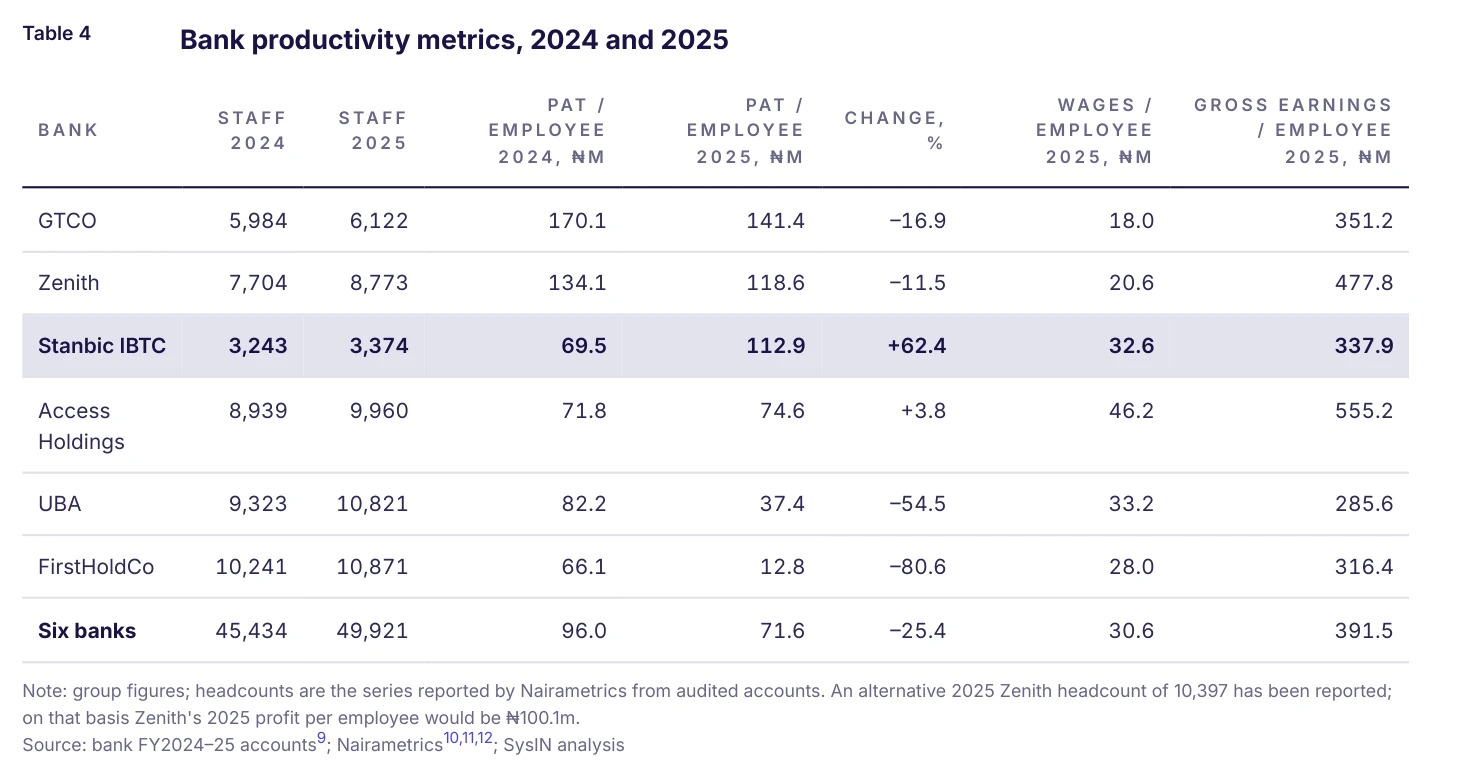
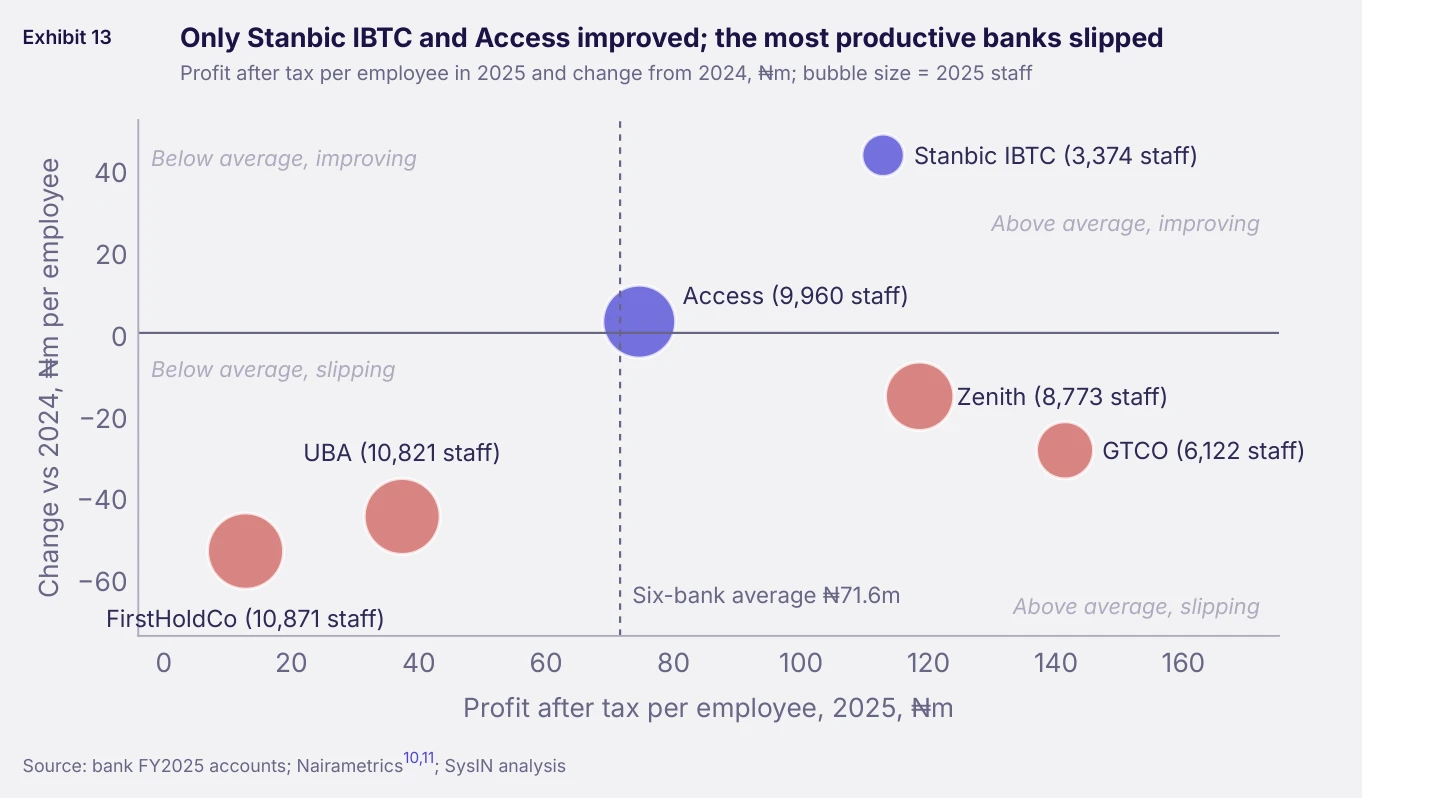
The six banks added 4,487 staff (+9.9%) and raised their wage bill 28%, while profit after tax fell 18%. Profit per employee fell 25%.
FirstHoldCo (–81% per employee) and UBA (–55%) are the Stragglers. Stanbic IBTC (+62%) is the only bank to improve materially.
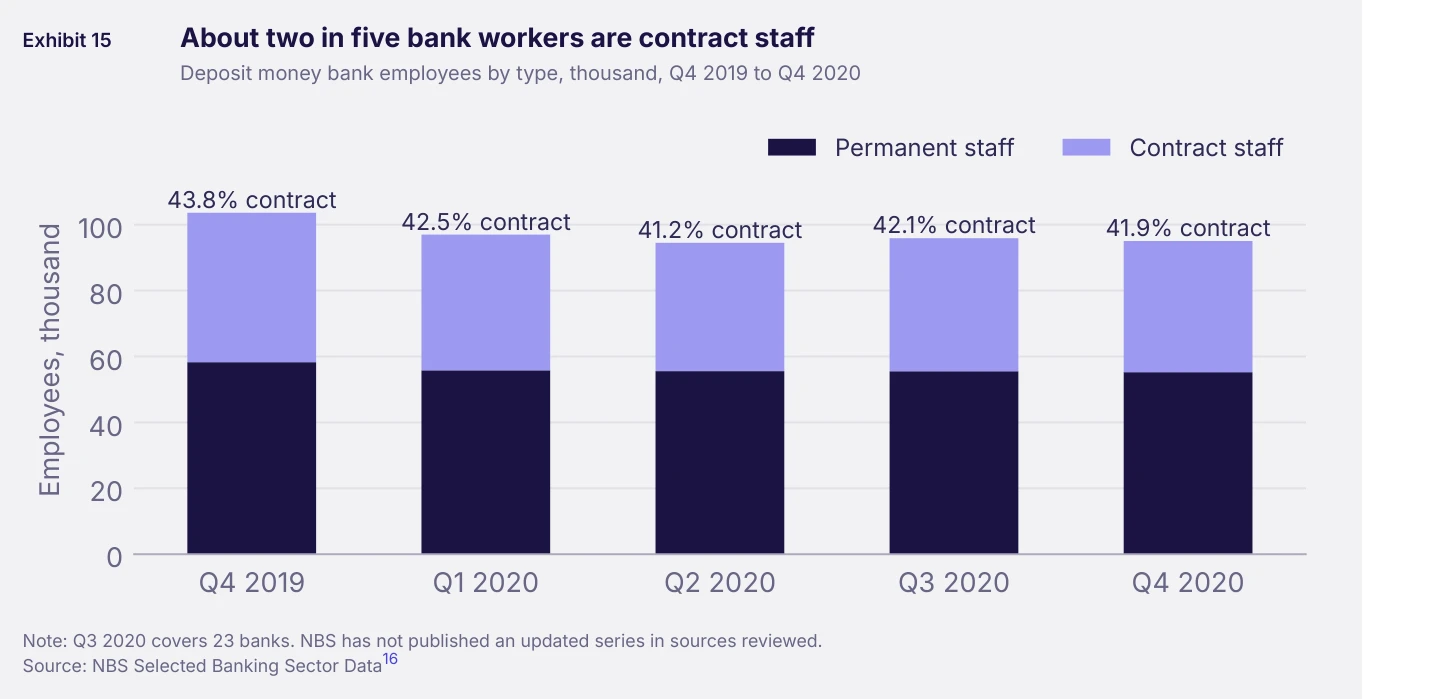
About 42% of the banking workforce is on contract and outside most headcounts, so true per-worker figures are lower still.
6. Staff are not moving to the best firms
Reallocation contributed about 2% of the non-financial gain and –₦0.4m of the banks' –₦24.4m change. In MGI's US sample it supplied almost half of growth. Nigeria looks more like Germany and the UK, where weaker firms hold on to staff.
What it means. Policy that treats productivity as a broad, slow diffusion across all firms will miss the firms that actually move the numbers. Nigeria needs better output data, a focus on the large firms that shape sector results, and conditions that let labour and capital move to the best of them.
Key findings
A handful of firms dominate
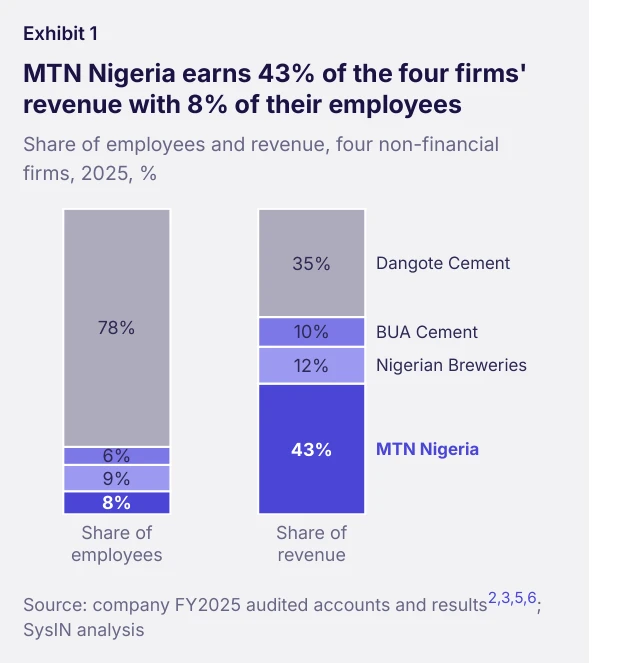
MTN Nigeria earned ₦2.60bn of revenue per employee in 2025, 12 times Dangote Cement's ₦209m, and 43% of the four non-financial firms' revenue with 8% of their staff.
Most naira gains are prices, not output
Dangote Cement's Nigerian revenue per tonne rose 3.9 times between 2019 and 2025, while tonnes of cement per employee stayed near 1,310–1,333.
FX swings distort profits
MTN Nigeria, Nestlé Nigeria and Dangote Cement booked ₦1.47tn of FX losses in 2024 and ₦158bn of gains in 2025.
Two Standouts drove the non-financial gain
BUA Cement and Nigerian Breweries delivered 47% of the 2024–25 rise in revenue per employee with 16% of the jobs.
Banks added staff as profits thinned
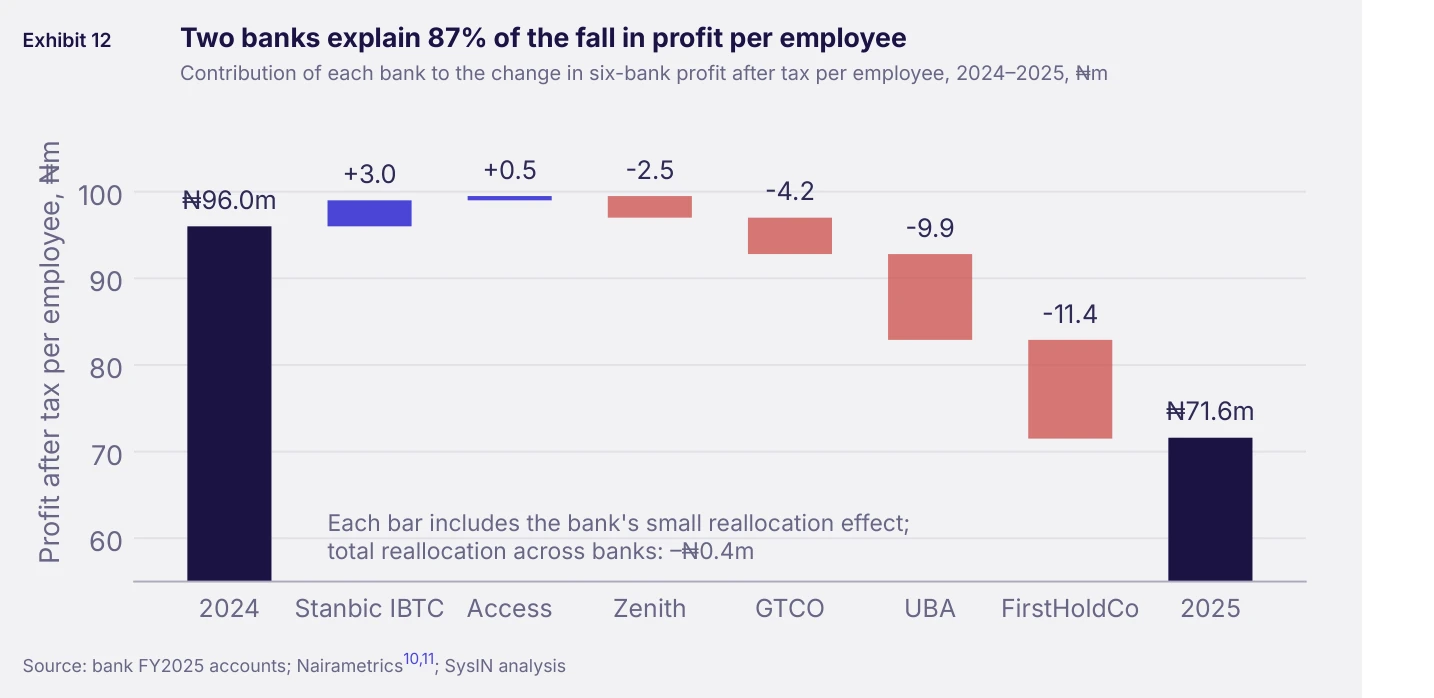
Six large banks added 4,487 staff (+9.9%) while profit after tax fell 18%; profit per employee fell 25%, and FirstHoldCo and UBA explain 87% of the fall.
Workers did not move to the best firms
Reallocation contributed about 2% of the non-financial gain, against almost half of growth in MGI's US sample.
At a glance
When firms get more productive, so do economies. This report applies McKinsey Global Institute's firm-by-firm approach to Nigeria for the first time, using the disclosed accounts of 10 large formal firms: four in cement, brewing and telecoms, and six banks. Together they employ about 76,000 people.
A few firms sit far ahead. MTN Nigeria generated ₦2.6bn of revenue per employee in 2025, 12 times Dangote Cement's ₦209m. MTN earns 43% of the four non-financial firms' revenue with 8% of their staff.
Most naira gains are price, not output. Dangote Cement's price per tonne in Nigeria rose 3.9 times from 2019 to 2025.
Economy-wide prices rose 2.1 times. Tonnes produced per employee hardly moved.
Small firms punched above their weight. BUA Cement and Nigerian Breweries, with 16% of the jobs among the three firms we could compare, delivered 47% of their combined gain in revenue per employee in 2024–2025.
Banks went the other way. Six large banks added 4,487 staff (+9.9%) while profit after tax fell 18%. Profit per employee dropped 25%, and two banks, FirstHoldCo and UBA, account for 87% of the fall.
Workers did not move towards the best firms. Reallocation of staff from weaker to stronger firms contributed almost nothing among either the non-bank firms or the banks, unlike the United States in MGI's study.
The report in one paragraph
Nigeria's formal economy runs on a small number of very large firms, and their productivity varies enormously. Telecoms leads by a wide margin, cement and brewing follow, and the large banks sit in between. Since 2019, revenue and profit per worker have soared in naira, but most of that rise is the price level, the devalued naira and regulated price resets, not more output per person. Real output per worker in cement, the best-measured heavy industry, is flat. In 2025 the gains came from a few firms that cut costs, expanded capacity or repriced. Losses were concentrated in two banks working through loan clean-ups. Staff did not shift towards the stronger firms, so the economy-wide gain from reallocation that powered US productivity is missing. Raising Nigerian productivity will depend on helping the few firms that move the national numbers to scale, letting resources move towards them, and measuring output, not just naira.
Key figures
Firm-level productivity in Nigeria's formal economy, based on disclosed company accounts for 2019–2025.
12× MTN Nigeria's revenue per employee (₦2.6bn) relative to Dangote Cement's (₦209m) in 2025[2,3]
3.9× Rise in Dangote Cement's Nigerian revenue per tonne, 2019–2025, against 2.1× for economy-wide prices[3,13]
≈1,330 t Cement produced per Dangote employee in 2024 and 2025, essentially unchanged from about 1,310 in 2019[3,4]
47% Share of the 2024–25 rise in revenue per employee delivered by BUA Cement and Nigerian Breweries, with 16% of the jobs
–25% Change in profit after tax per employee at six large banks, 2024–25, from ₦96.0m to ₦71.6m[9,10,11]
87% Share of that decline explained by two banks, FirstHoldCo and UBA, which hold 44% of the six banks' staff
42% Share of Nigeria's bank workforce on contract, not counted in most banks' headcounts (NBS, 2020)[16]
₦1.47tn FX losses booked in 2024 by MTN Nigeria, Nestlé Nigeria and Dangote Cement, which turned into ₦158bn of gains in 2025[18,19,3]
Reading the numbers
Per employee figures divide a firm's annual revenue, EBITDA, operating profit or profit after tax by its disclosed headcount. Nominal figures are in current naira; real figures remove economy-wide price changes using the NBS GDP deflator (2019–2024) extended with 2025 average CPI inflation. ₦bn = billion naira; ₦tn = trillion naira; ₦m = million naira. Banks are analysed separately because their output is measured differently.
Glossary of firm descriptions
10 firms with clean, disclosed headcounts and financials for 2024 and 2025
We borrow MGI's vocabulary for the roles firms play in productivity growth, and adapt the thresholds to a small Nigerian sample.
Term: what it means in this report
Firm roles
Standout A firm whose share of its comparison group's productivity gain is at least twice its share of the group's employees; in a group whose productivity fell, a firm that improved materially. We compare non-bank firms with each other and banks with each other. MGI uses a 1 basis point threshold across 8,300 firms; with 10 firms, a relative rule is more meaningful.
Straggler A firm that accounts for at least a fifth of its comparison group's productivity decline.
Improver A large firm that contributes mainly by raising its own productivity.
Disruptor A smaller firm (under 10% of its group's employment) that raises productivity rapidly.
Scaler An above-average firm that contributes by gaining employment share.
Restructurer A firm that contributes by shrinking, exiting or resetting its cost base.
Frontier firm The most productive firm or firms in a comparison group.
Measures
Value-added proxy EBITDA plus wages and salaries. MGI measures productivity as real value added per worker; this proxy is the closest equivalent Nigerian disclosures allow, and is available here for MTN Nigeria and Dangote Cement.
Revenue per employee Annual revenue divided by headcount. Available for all four non-financial firms; used as the common crossfirm measure, with the caveat that it includes bought-in inputs.
Within-firm effect A firm's starting share of its group's employment multiplied by the change in its own productivity.
Reallocation effect The change in a firm's employment share multiplied by how far its productivity is above or below the group's starting average. Positive when staff move towards more productive firms.
Physical productivity Output measured in units rather than naira, such as tonnes of cement per employee. Immune to price changes.
Gross earnings A bank's total interest, fee, trading and other income before expenses; the bank equivalent of revenue.
Why measure productivity firm by firm
2/3
National statistics tell us how fast Nigeria's productivity grows. Only firm-level data can tell us who is driving it, and how.
Share of productivity growth generated by fewer than 100 Standouts among 8,300 large firms in the US, Germany and the UK, 2011–19[1]
Most work on Nigerian productivity looks at the economy as a whole, or at anonymous survey firms. The World Bank's Enterprise Surveys, for example, show that worker education, firm size, credit and power reliability shape Nigerian firms' productivity[20]. They do not name the firms that matter most.
MGI's The Power of One took a different route. It measured each large firm's contribution to national productivity growth and found that growth comes in bursts from a few firms making bold moves: new business models, portfolio shifts, scale. Efficiency programmes played a smaller role[1].
Nigeria differs from MGI's three economies in ways that shape the method:
Data. There is no firm database comparable to MGI's. Everything here comes from annual reports and results releases.
Prices. Inflation averaged 23% in 2025[15] and the naira was devalued in 2023–24. Naira growth must be separated from real output growth.
FX. Revaluation gains and losses swing reported profits by hundreds of billions of naira. They are kept out of the productivity measures.
Informality. The informal sector is about 42.5% of GDP[13]. This report covers the formal corporate core only.
Labour. Banks and telecoms use many contract staff who do not appear in headcounts[16].
What Nigerian firms disclose
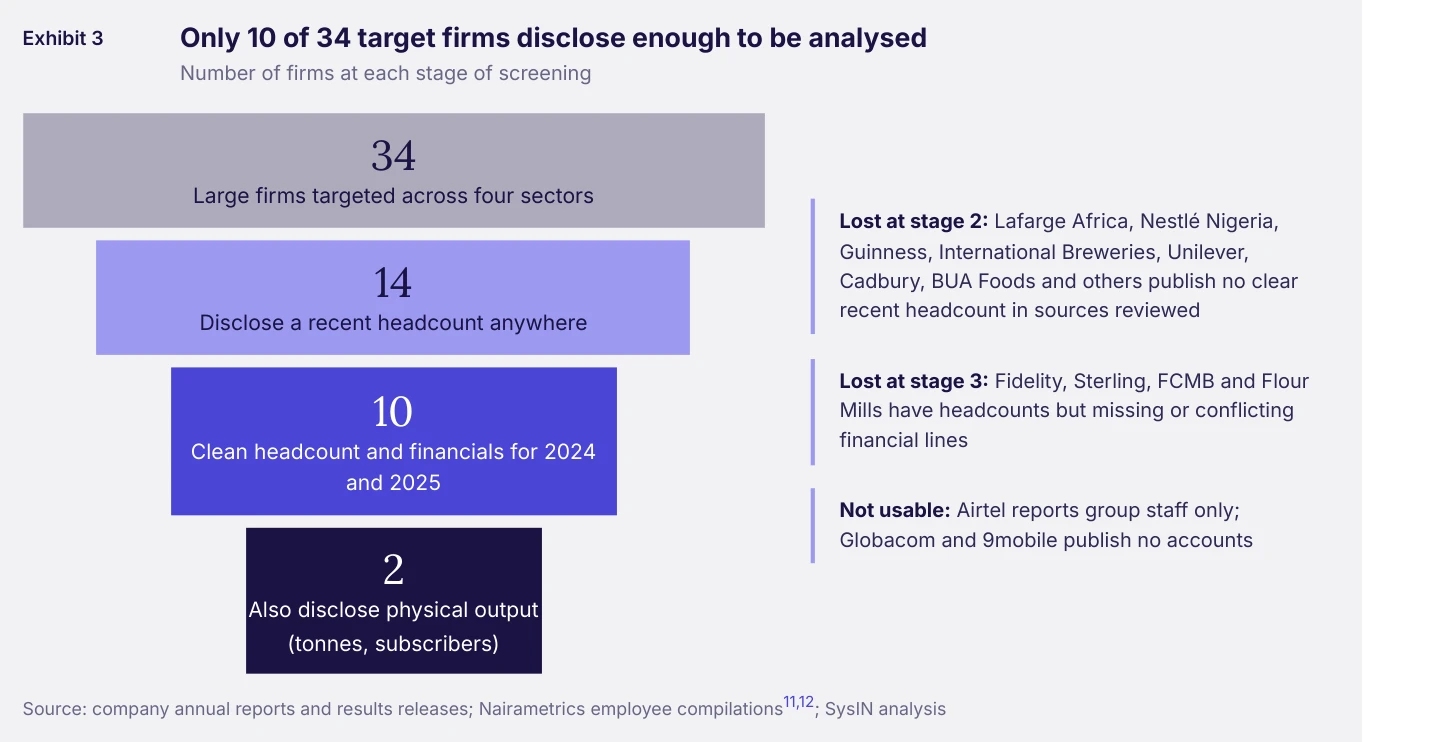
10 of 34 Target firms with clean 2024 and 2025 headcount and financial data
Disclosure, not analysis, is the binding constraint. Fewer than a third of the large firms targeted publish what a firmlevel study needs.
We targeted 34 large firms across four sectors: cement, FMCG and beverages, telecoms and banking. These sectors are almost entirely formal in NBS's classification. All publish audited accounts, and most are listed on the Nigerian Exchange. But a firm-level productivity study needs a consistent headcount alongside revenue and profit for the same year and scope. That is where most fall away (Exhibit 3).
A few firms sit at the frontier
₦2.6bn MTN Nigeria's revenue per employee in 2025, about US$1.7m at the 2025 average official rate
Productivity in Nigeria's formal core is extremely uneven. One telecoms firm creates more revenue per worker than the next three firms combined.
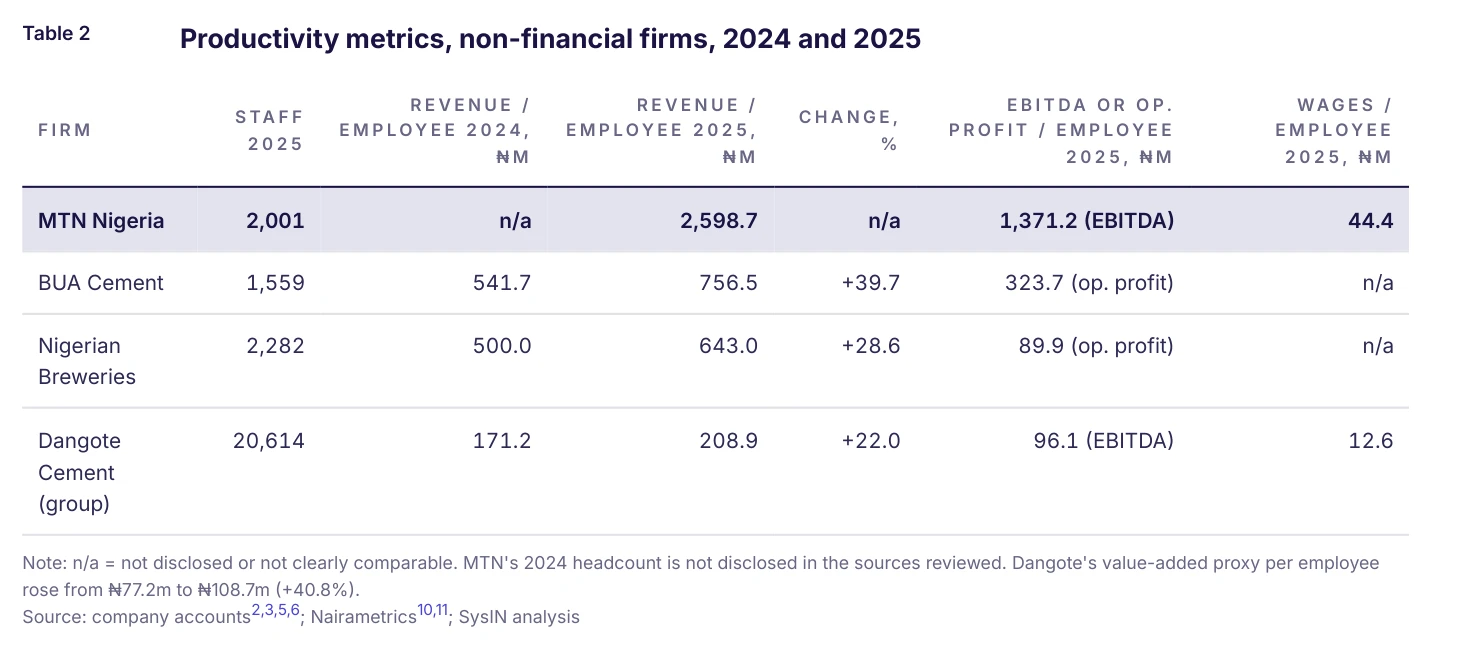
Exhibit 4 lays out the four non-financial firms as MGI does: each bar's width is the firm's share of employees, its height revenue per employee. MTN Nigeria's narrow, tall bar dominates. With 2,001 employees it generated ₦5.2tn of revenue and ₦2.74tn of EBITDA in 2025[2]. Dangote Cement's wide, low bar reflects a very different model. With 20,614 full-time staff, it runs a large in-house logistics fleet of more than 7,000 trucks and operates in 10 other African countries[3].
Revenue per employee overstates differences in value created, because cement and beer require more bought-in inputs than mobile data. On the value-added proxy (EBITDA plus wages), available for two firms, the gap is similar. MTN creates ₦1.42bn of value added per employee against ₦109m at Dangote Cement, a 13-fold difference. Telecoms is capital- and spectrum-intensive, so high labour productivity is partly built in.
Sidebar:Do the most productive firms pay the most?
MGI found that firms with the fastest productivity growth also raised wages fastest[1]. Nigerian disclosures allow a partial check. MTN Nigeria, the productivity leader, paid ₦44.4m per employee in wages and salaries in 2025, three and a half times Dangote Cement's ₦12.6m. The large banks paid between ₦18.0m (GTCO) and ₦46.2m (Access).
But workers' share of the value created is small and shrinking. Wages were 3.1% of MTN's value-added proxy. At Dangote Cement they fell from 14.4% to 11.6% between 2024 and 2025, as wages per employee rose 13% against average inflation of 23%. Naira productivity gains have not reached pay packets in real terms.
The banks show a narrower but still wide spread (Exhibit 5). Access and Zenith earn ₦555m and ₦478m of gross income per employee. UBA, with the largest workforce, earns ₦286m. Bank gross earnings in 2025 were inflated by high interest rates, so the levels say more about balance-sheet scale and rates than about output.
Price, not volume
+2% Change in tonnes of cement per Dangote employee, 2019–2025, against a 4.2-fold rise in naira revenue per employee
Between 2019 and 2025, Nigeria's formal firms grew their naira takings per worker many times over. The bestmeasured case shows almost no change in what each worker produces.
Dangote Cement is the rare Nigerian firm that discloses both physical volumes and headcount over time, making it a natural test case. Its group revenue per employee rose from ₦49.4m in 2019 to ₦208.9m in 2025. Over the same period:
Nigerian cement volumes rose 25%, from 14.1Mt to 17.7Mt, and were flat in 2025[3].
Revenue per tonne in Nigeria rose 3.9 times, from ₦43,218 to ₦167,185, and EBITDA per tonne from ₦25,583 to ₦99,723. Group tonnes per employee were about 1,311 in 2019, 1,325 in 2024 and 1,333 in 2025[3,4].
Cement's price rise outpaced general inflation by a wide margin: 3.9 times against 2.1 times. Deflated by the economywide price level, Dangote's revenue per employee roughly doubled between 2019 and 2024 (₦98.3m in 2019 prices). It then fell slightly in 2025 (₦97.5m). That "real" doubling is a rise in cement's relative price, not more output per worker. A study that deflated with the GDP deflator alone, as many would, would wrongly credit it to productivity.
The same pattern in brewing and telecoms Brewers show the same price-led pattern. Nigerian Breweries' revenue rose 35% to ₦1.47tn in 2025. Its chief executive said volumes dipped slightly as cost pressures and cautious shoppers bit[17]. Across the four listed brewers, revenue topped ₦2.8tn against ₦1.89tn in 2024.
Telecoms is the partial exception. MTN Nigeria's 2025 revenue jump owed much to the tariff increase the NCC approved in January 2025, capped at 50% and the first since 2013. But its volumes also grew: subscribers rose from 80.9m to 87.3m (+8%) and active data users from 47.7m to 53.2m (+12%)[2]. Since 2019, subscribers have grown 36% and data users have more than doubled. Each MTN employee now serves about 43,600 subscribers.
Implication
Naira revenue per worker is a poor guide to Nigerian productivity after 2023. Sector-level output prices and physical volumes are needed to know whether firms are producing more or simply charging more. NBS sector deflators and company volume disclosures should be standard inputs to any productivity analysis.
The FX swing beneath the profits
For many large firms, 2024's losses and 2025's recovery were made in the treasury, not on the factory floor. ₦1.47tn
FX losses booked in 2024 by three firms: MTN Nigeria, Nestlé Nigeria and Dangote Cement
The naira's devaluation forced firms with dollar debts or dollar-denominated obligations to book large revaluation losses in 2024. As the currency stabilised in 2025, those losses turned into gains. The swings dwarf year-to-year changes in operating performance:
MTN Nigeria went from a ₦925.4bn net FX loss and a ₦400bn loss after tax in 2024, to a ₦90.3bn gain and ₦1.11tn profit in 2025[2,18].
Nestlé Nigeria moved from a loss of about ₦290.7bn to a gain of about ₦40.1bn. Its finance costs fell from ₦392.8bn to ₦101.0bn[7,19].
Dangote Cement moved from a ₦249.3bn loss to a ₦27.8bn gain[3].
This is why the productivity measures in this report stop at operating profit or EBITDA for non-financial firms. Both are recorded above the finance line, so FX revaluation is excluded. Net profit per employee would show MTN Nigeria as one of the least productive firms in 2024 and among the most productive in 2025, with no change in its operations. For banks, FX revaluation and trading gains inflated 2024 earnings, and their absence in 2025 is part of the decline described in Section 08.
Firms are de-dollarising their balance sheets in response. Nigerian Breweries used the proceeds of its 2024 rights issue to repay FX liabilities, and its net finance costs fell 83% in 2025[6]. Lafarge Africa repaid all its loans and borrowings, reporting a zero balance at the end of 2025[8].
Standouts among non-bank firms
47% Share of the three firms' 2024–25 rise in revenue per employee from BUA Cement and Nigerian Breweries, with 16% of the jobs
In 2025, two of the three firms with comparable data delivered nearly half of their combined gain with a sixth of the workers.
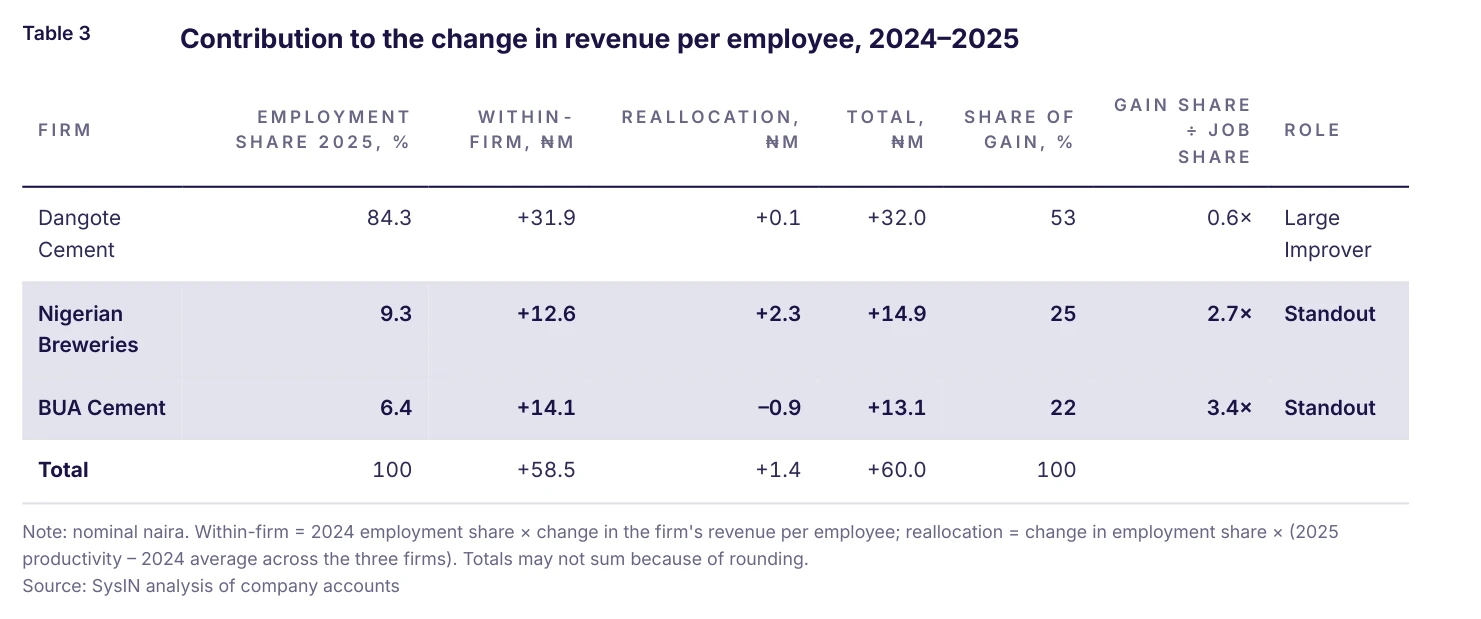
Three non-financial firms disclose revenue and headcount for both 2024 and 2025: Dangote Cement, BUA Cement and Nigerian Breweries. Together their revenue per employee rose from ₦224.4m to ₦284.3m, a gain of ₦60m (+27% nominal, about +3% after inflation). Following MGI, we split that gain into each firm's own productivity change and the effect of staff moving between firms (Exhibit 9 and Table 3).
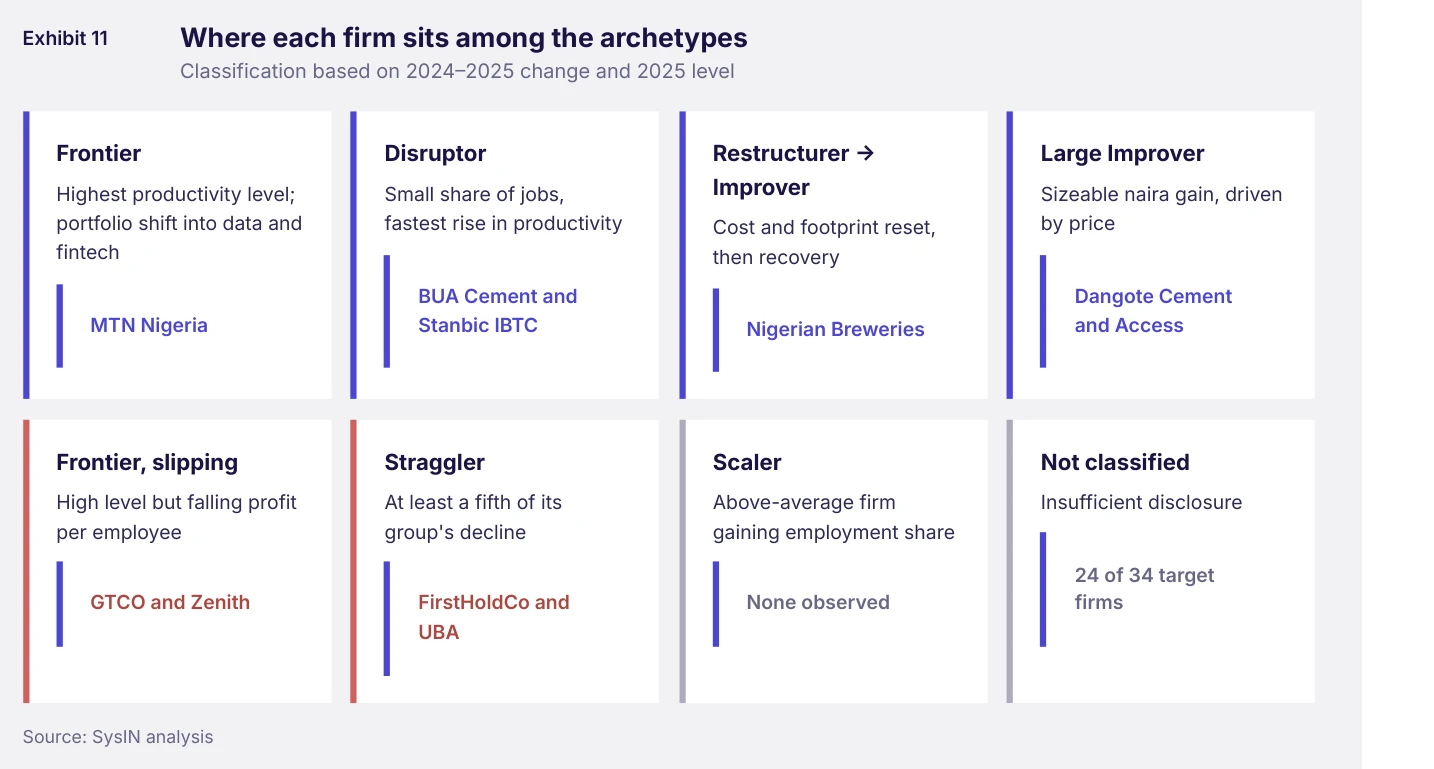
What the Standouts did BUA Cement raised revenue per employee 40% and operating profit per employee 3.6 times, to ₦323.7m, while its permanent workforce fell from 1,618 to 1,559. Its operating margin rose from 16.5% to 42.8%. The gains followed an expansion of installed capacity from 11 to 17 Mtpa in 2024, backed by gas-fired captive power[5]. With 6% of the three firms' staff, BUA fits MGI's Disruptor archetype: a smaller firm raising productivity fast.
Nigerian Breweries is a Restructurer turned Improver. After a ₦145bn loss in 2024, it suspended two breweries, recapitalised through a ₦600bn rights issue and repaid FX debt. In 2025 its revenue per employee rose 29% and operating profit per employee 2.8 times, to ₦89.9m, even as headcount rose 5%[6].
Dangote Cement contributed the largest naira amount because of its size, but less than its share of employment. Its gain was almost entirely price. In 2019 prices, its revenue per employee slipped 0.8% in 2025, while BUA's rose about 14% and Nigerian Breweries' about 5%.
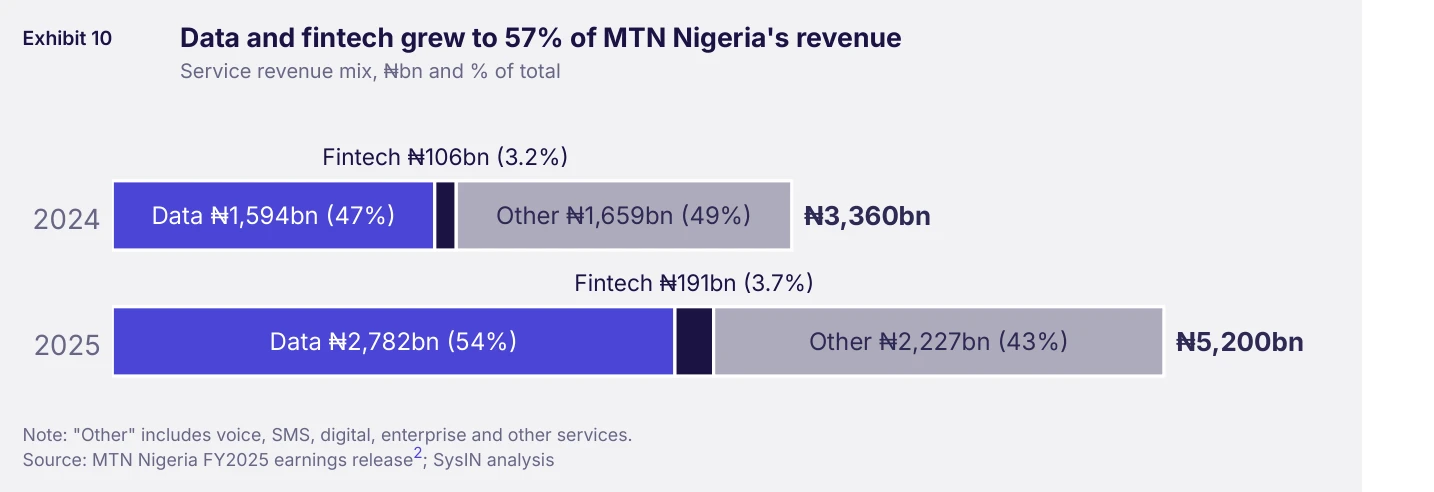
MTN Nigeria cannot be included in the decomposition because its 2024 headcount is not disclosed. Its shift towards data and fintech is the clearest case of MGI's "portfolio shift" move in Nigeria (Exhibit 10).
Banks: more staff, thinner profits
–25% Change in profit after tax per employee, six banks, 2024–2025 (₦96.0m to ₦71.6m)
The six largest banks with clean data hired nearly 4,500 people in 2025 as profits fell. Two of them explain almost all of the drop in profit per employee.
Bank productivity is harder to measure than industrial productivity. Interest margins, fees and trading gains are hard to deflate, and 2023–24 earnings were inflated by FX revaluation. We therefore use two measures: gross earnings per employee (2025) and profit after tax per employee (2024 and 2025), with headcounts from the banks' own disclosures.
The decline was concentrated. FirstHoldCo's profit per employee fell 81% and UBA's 55%. Together they hold 44% of the six banks' staff and explain ₦21.3m of the ₦24.4m drop. Zenith attributed its lower profit to a clean-up of loans that had been under regulatory forbearance; its pre-provision profit was broadly flat at about ₦2.0tn[9]. Stanbic IBTC was the clear Standout, raising profit per employee 62% to ₦112.9m with modest hiring.
As among the non-bank firms, staff did not move towards the more productive banks. The two Stragglers, UBA and FirstHoldCo, grew headcount by 16% and 6%. GTCO, the most profitable per employee, grew by just 2%. Reallocation contributed –₦0.4m, about 2% of the change. In MGI's US sample, reallocation accounted for almost half of productivity growth[1].
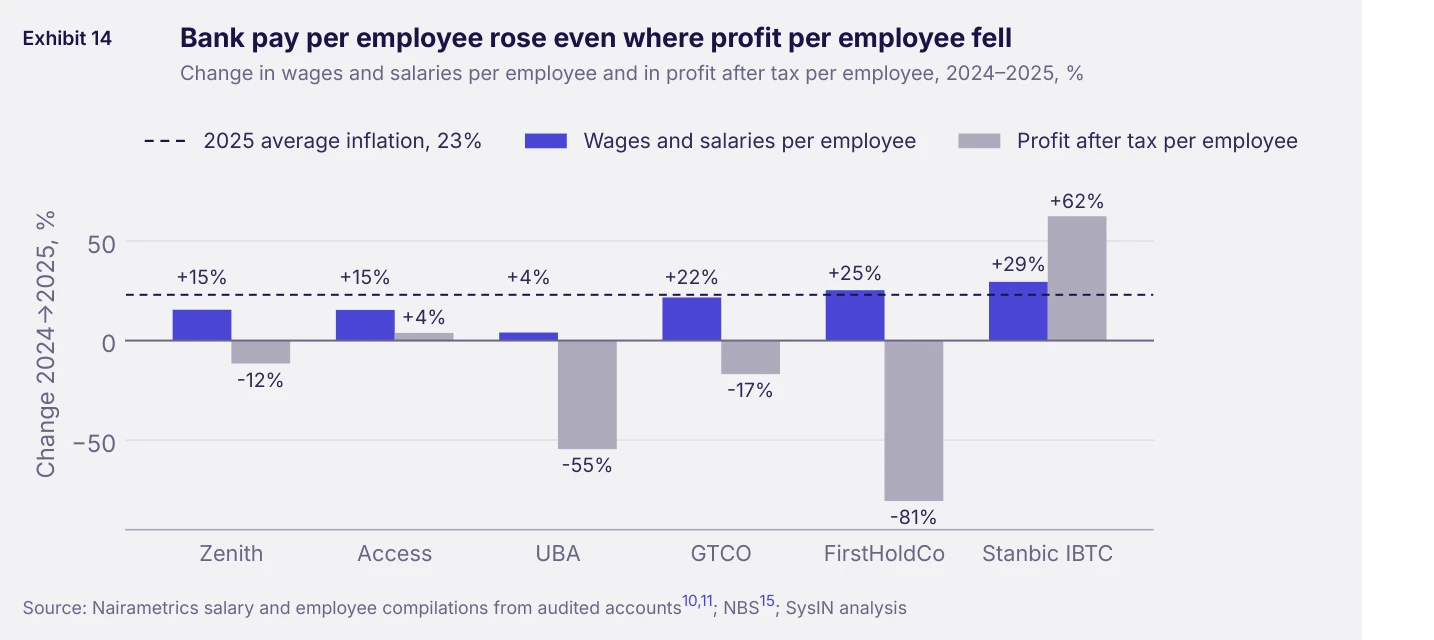
Wages proved sticky, a pattern MGI also found in Europe[1]. Wages and salaries per employee rose at all six banks, by 4% (UBA) to 30% (Stanbic IBTC). The six banks' combined wage bill rose 28% to ₦1.53tn. Yet average pay per employee rose 16.8%, below 2025 average inflation of 23%, so the typical bank worker's real pay fell.
The hidden workforce
Banks' published headcounts largely exclude contract and outsourced staff, who made up 41–44% of the industry's workforce in the last NBS series. If the six banks' contract share matches the industry average, their true workforce is about 1.7 times the disclosed figure. Per-worker productivity would then be about 40% lower than shown in Table 4. Rankings between banks may also shift, since outsourcing practices differ.
How Standouts moved: five moves in a Nigerian setting
+74% Growth in MTN Nigeria's data revenue in 2025, to ₦2.78tn
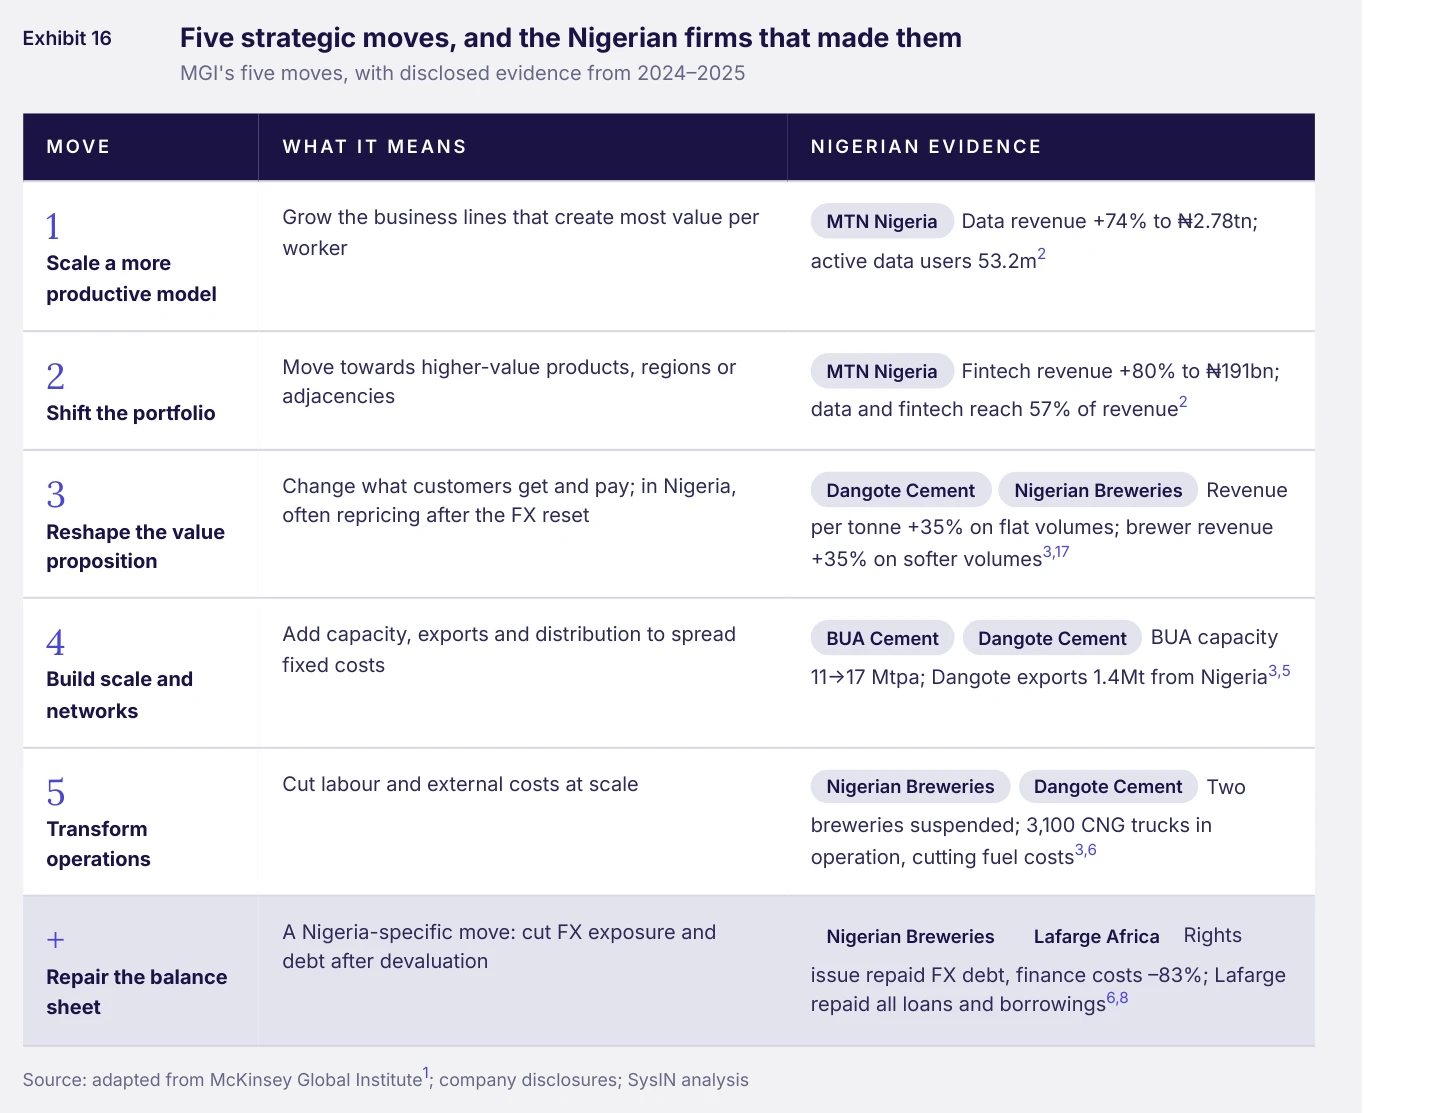
MGI found that Standouts rarely won through efficiency alone. Nigerian evidence points the same way, with one addition: repairing the balance sheet after the FX shock.
Two cautions apply. First, repricing (move 3) raised naira productivity but not output per worker. It restored margins after the FX shock rather than creating new customer value, and the 2025 telecoms tariff reset was a regulatory decision. Second, efficiency programmes (move 5) were important in Nigeria in 2024–25 because firms were recovering from losses. MGI's evidence suggests sustained productivity growth will need moves 1, 2 and 4: new products, portfolio shifts and scale.
A productivity agenda for Nigeria
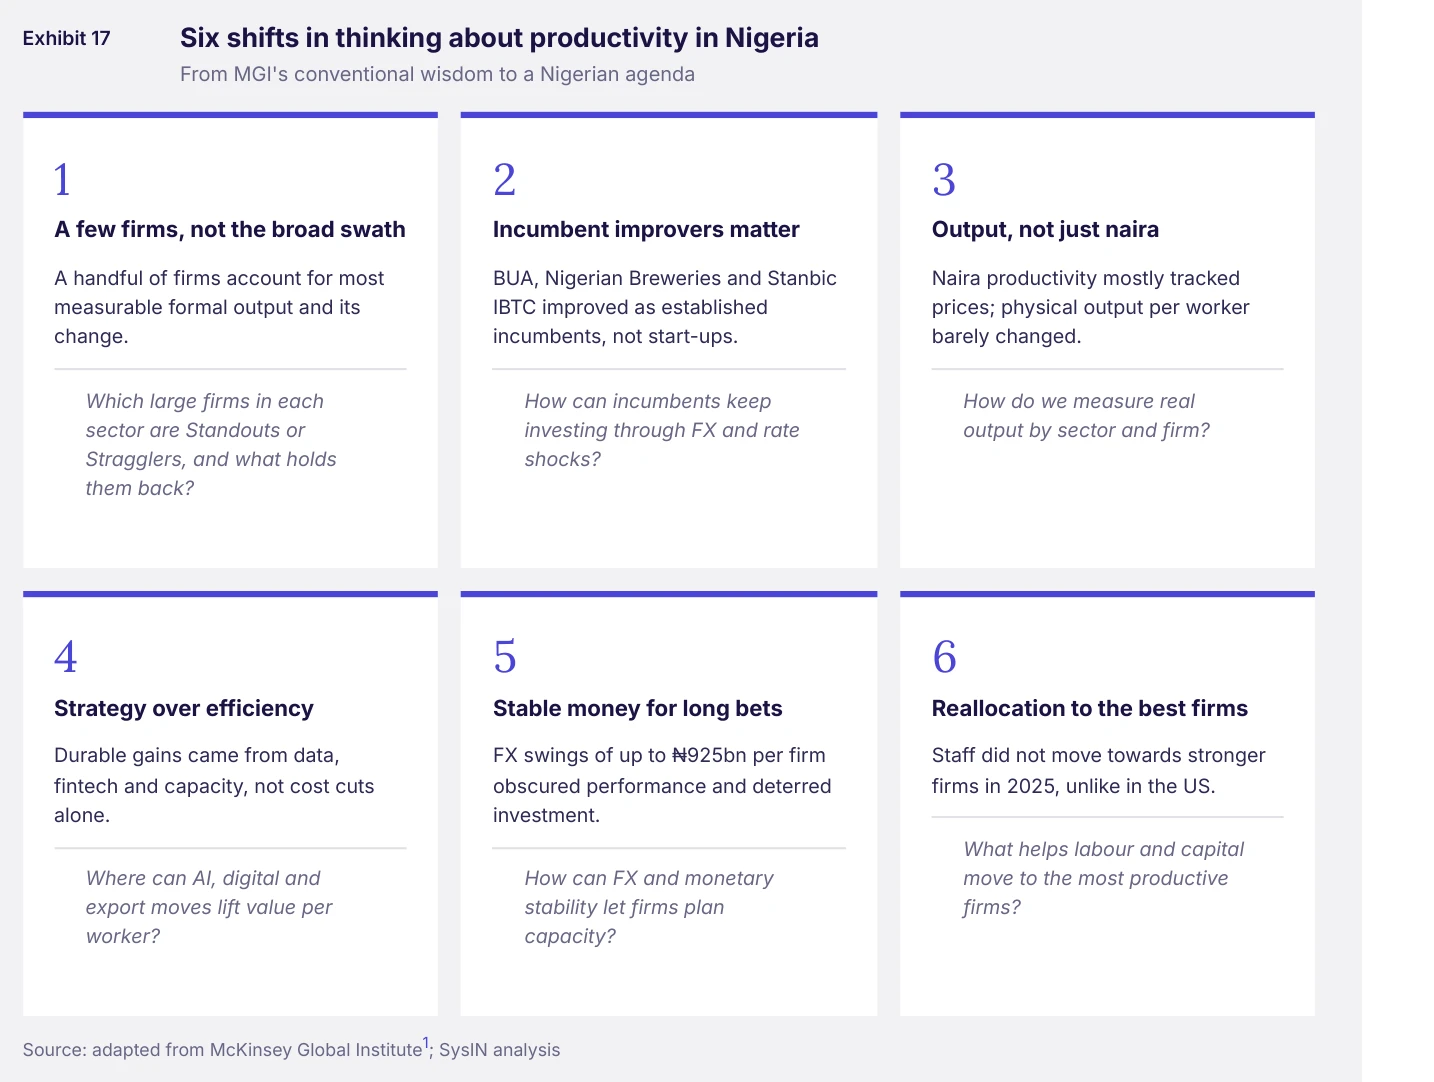
MGI drew six shifts in thinking from its findings. Each applies to Nigeria, sometimes with more force. 6
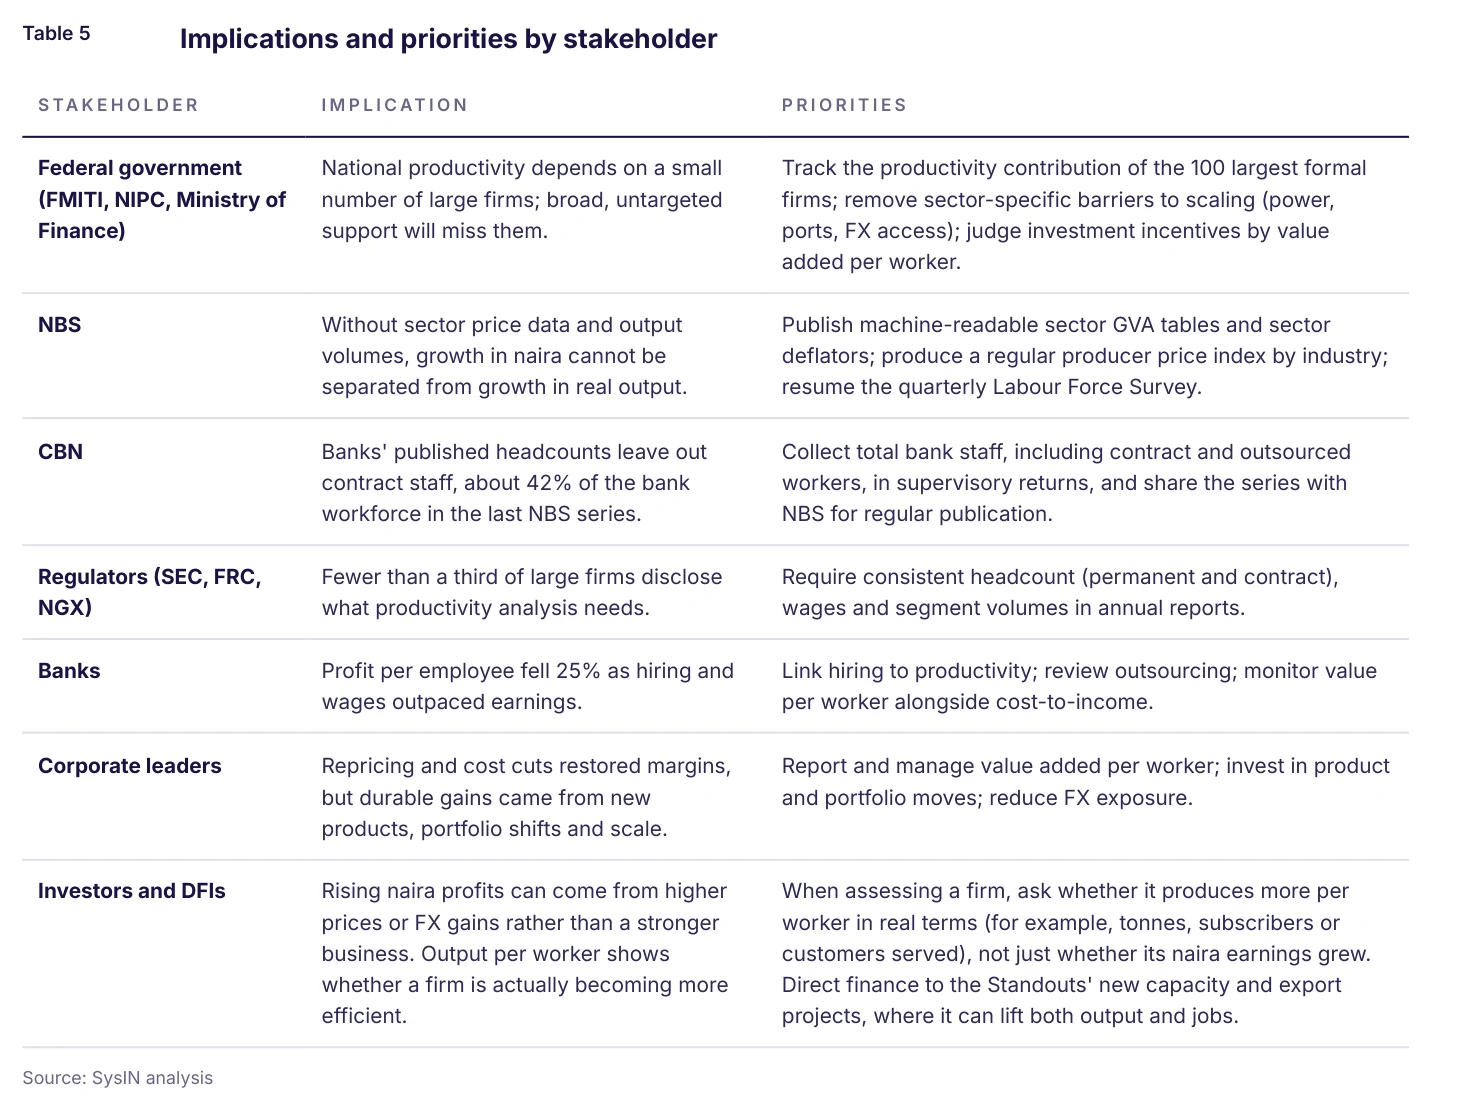
Shifts in thinking for business leaders and policymakers
Implications for government strategy on the labour market
93% Share of Nigerian employment that is informal (NBS, Q2 2024)[23]
The firms that drive Nigeria's productivity create few jobs directly. Labour-market strategy has to work through them, not around them.
Nigeria's labour market is large, young and overwhelmingly informal. At the end of 2023 the labour force was 88.94 million people, of whom 84.15 million were employed[22]. In the second quarter of 2024, unemployment was 4.3%, informal employment 93% and self-employment 85.6% of all jobs[23]. Wage employment covered only about 12–13% of workers in 2023[23]. NBS has not published a new Labour Force Survey since November 2024[24].
4.3% Unemployment rate, Q2 2024; 13% when time-related underemployment is added[23]
85.6% Share of employed people who are self-employed, Q2 2024[23]
0.09% Share of national employment in the 10 firms analysed (76,377 staff)
84.2m Employed Nigerians, end-2023, in a labour force of 88.9m[22]
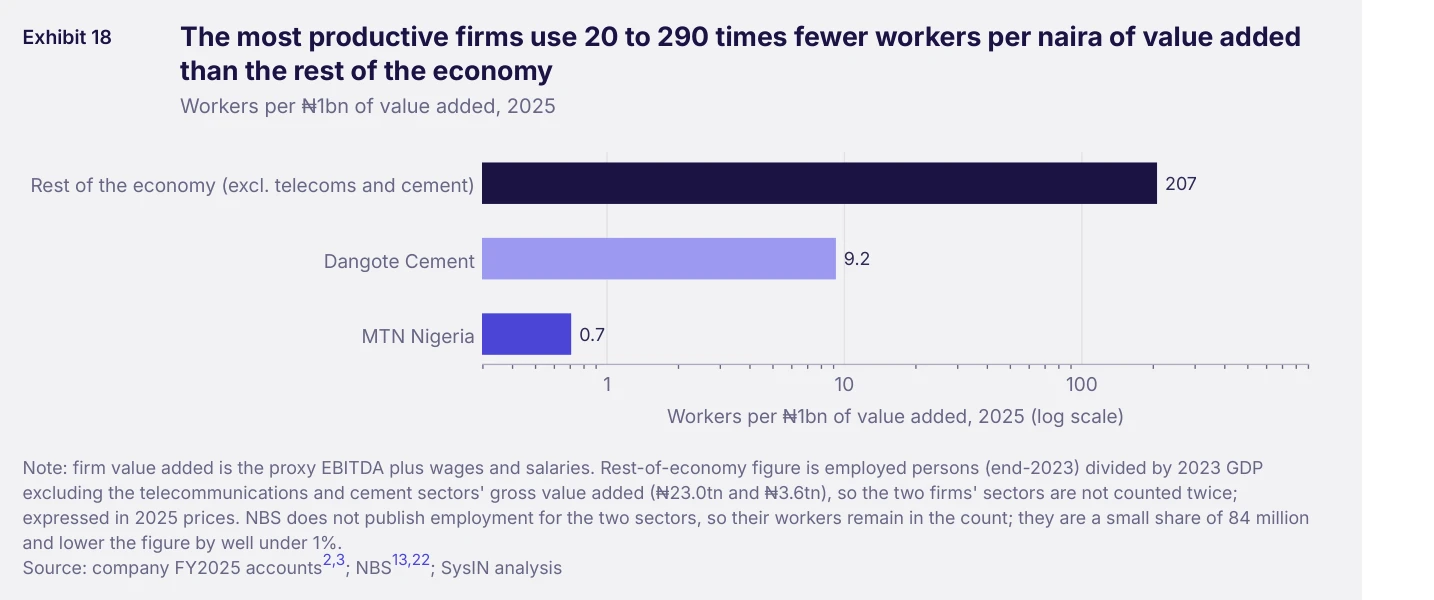
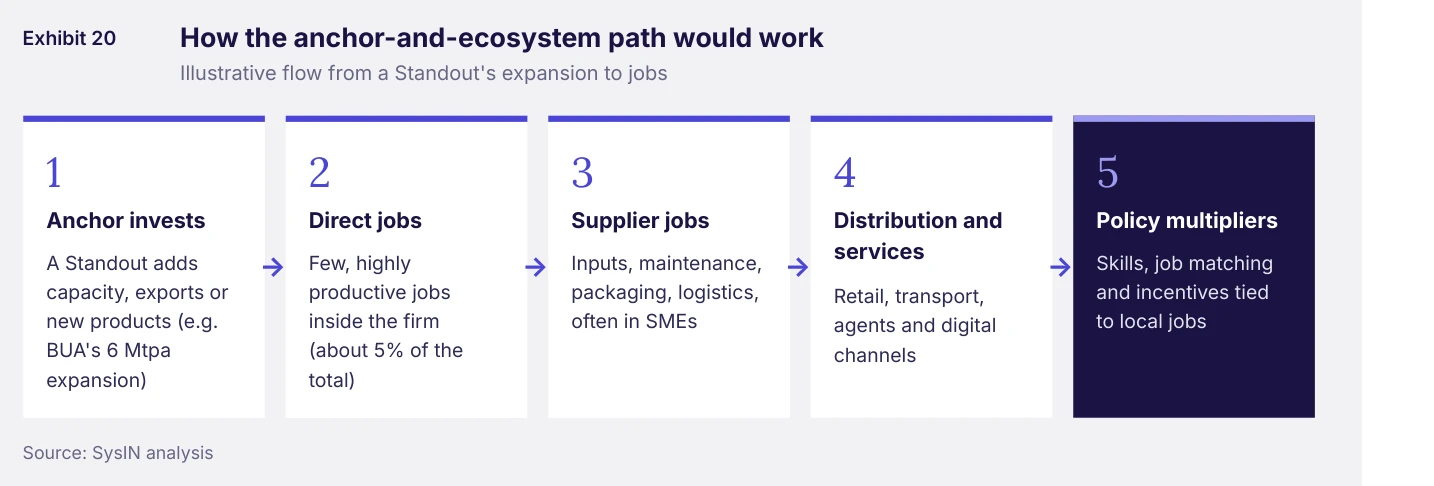
This is the central tension for labour policy. The Standouts lift output per worker because they are capital- and technologyintensive: MTN Nigeria uses 0.7 workers per ₦1bn of value added, Dangote Cement 9.2, and the rest of the economy about 207. Their main contribution to employment is indirect, through suppliers, distributors, contractors and the spending of their workers, and through the taxes and infrastructure they fund.
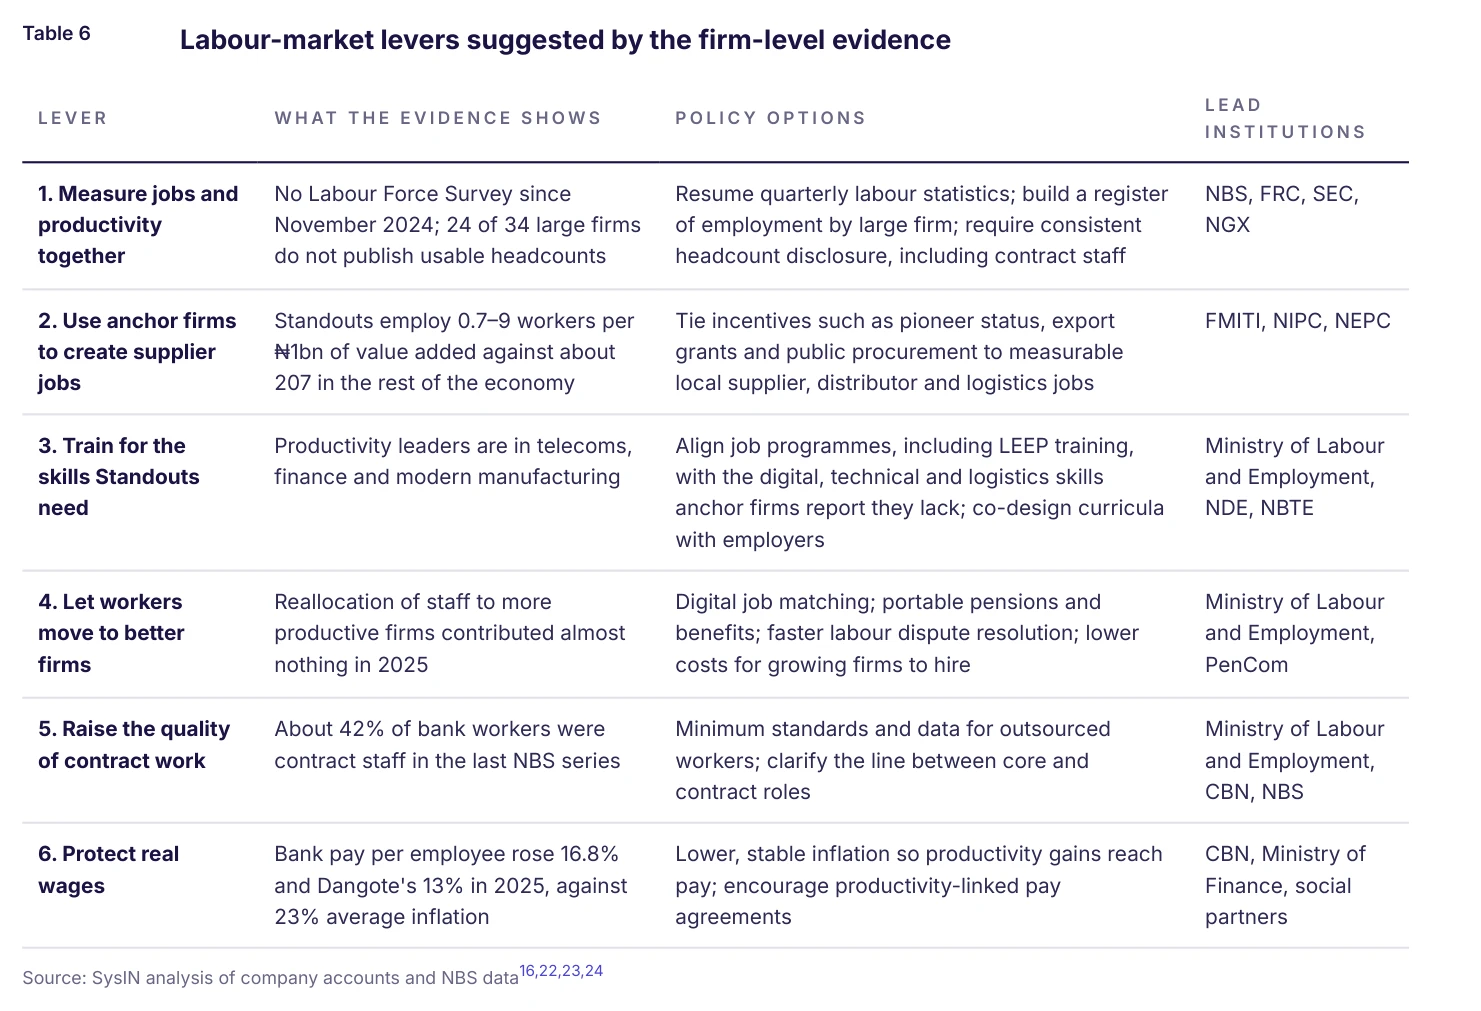
The findings of this report point to six levers for government labour-market strategy (Table 6).
The strategic choice
Government can pursue jobs and productivity together, but not by asking the most productive firms to hire millions directly. The practical route is to help a few anchor firms grow faster, and to make sure the supplier, distribution and service jobs around them are counted, skilled and connected to the people who need work.
Employing Nigeria's workforce: scenarios for 2.5 million jobs
33× 2.5 million jobs compared with the combined workforce of the 10 firms analysed
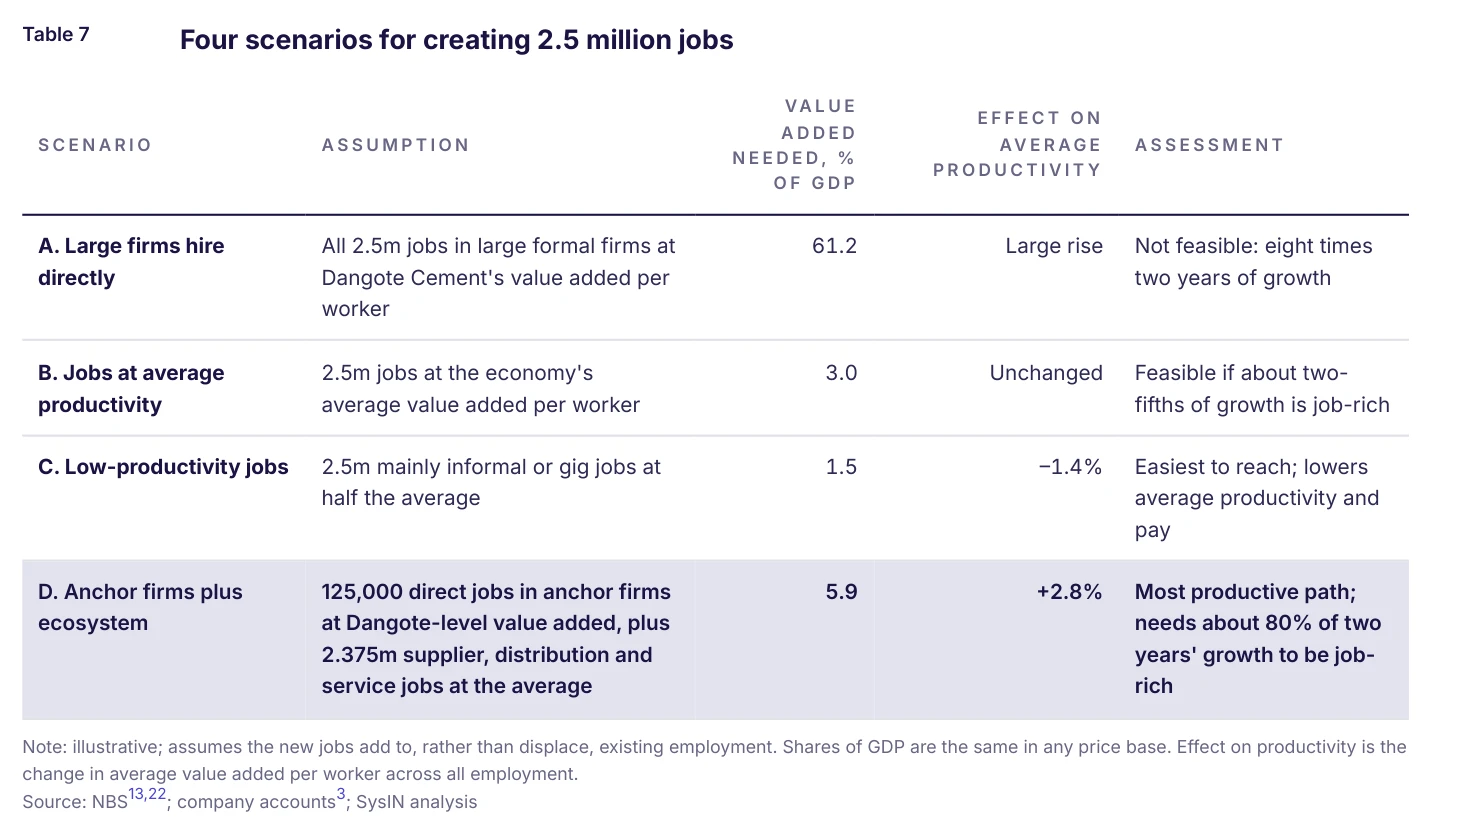
The federal government aims to create 2.5 million jobs in two years. Where those jobs come from, and at what productivity, matters as much as the number.
The policy:Labour Employment and Empowerment Programme (LEEP)
Vice President Kashim Shettima launched LEEP on 15 April 2025. It was first announced by President Bola Tinubu in his Independence Day speech in October 2024. It targets 2.5 million jobs in two years across all sectors, including the gig economy. Its tools are training and reskilling, technology to connect employers with job-ready workers, and partnerships with the private sector, civil society, trade unions and international partners. Funding was not stated at launch[21].
The scale of the target. 2.5 million jobs equal about 3.0% of the 84.15 million people employed at the end of 2023, or roughly a quarter of the 10.5 million wage jobs in the economy[22,23]. It is 33 times the combined workforce of the ten firms in this report, and 121 times Dangote Cement's 20,614 staff.
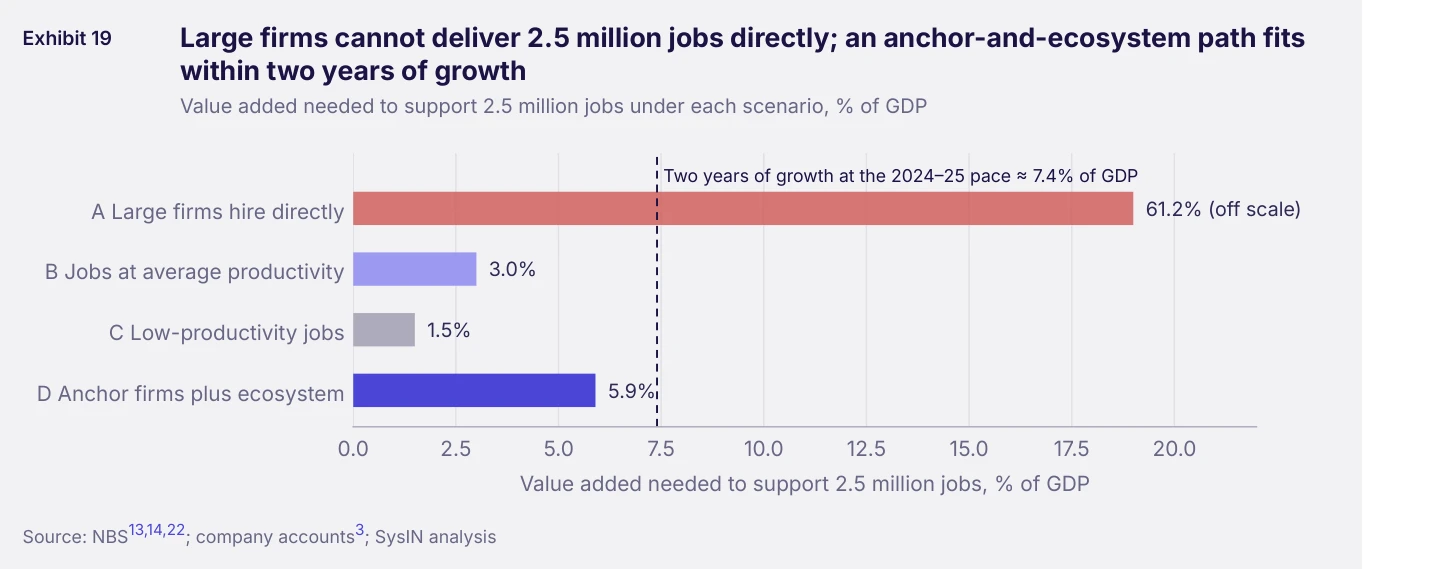
Our approach. Every job needs output to pay for it. We estimate the value added needed to support 2.5 million jobs under four scenarios, using average value added per worker in the economy (GDP divided by employment: ₦3.73m in 2023, about ₦5.3m in 2025 prices) and the value-added proxy of a large formal firm (Dangote Cement: ₦108.7m in 2025). We express each as a share of GDP and compare it with what two years of growth at the 2024–25 pace (3.4% and 3.9%) would add: about 7.4%[13,14].
What the scenarios mean
The target is achievable in arithmetic terms. Scenarios B, C and D all fit within the output that two years of growth at the recent pace would add. The question is the quality of the jobs, not just their number.
Large firms cannot be the direct source. Scenario A would need value added equal to 61% of GDP. Even doubling the 10 firms' workforce would create only 76,000 jobs.
The quickest route lowers productivity. Scenario C reaches 2.5 million fastest but cuts average value added per worker by 1.4%. With 93% of jobs already informal, more low-productivity work would widen the gap between the formal core and everyone else.
The productive route runs through anchor firms. In scenario D, a few Standouts expand and pull 2.4 million jobs into their supply and distribution chains. Average productivity rises 2.8%, but almost all of two years' growth must be jobrich, so the economy would need to grow faster than recently for wages to rise too.
i WHATTOWATCH
Progress towards the 2.5 million target can only be judged with regular data. The priorities are a resumed quarterly Labour Force Survey, reporting of LEEP placements by sector and firm, and firm-level disclosure of direct and contract staff. Together these would show not just how many jobs are created, but how productive they are.
Data gaps and what to watch
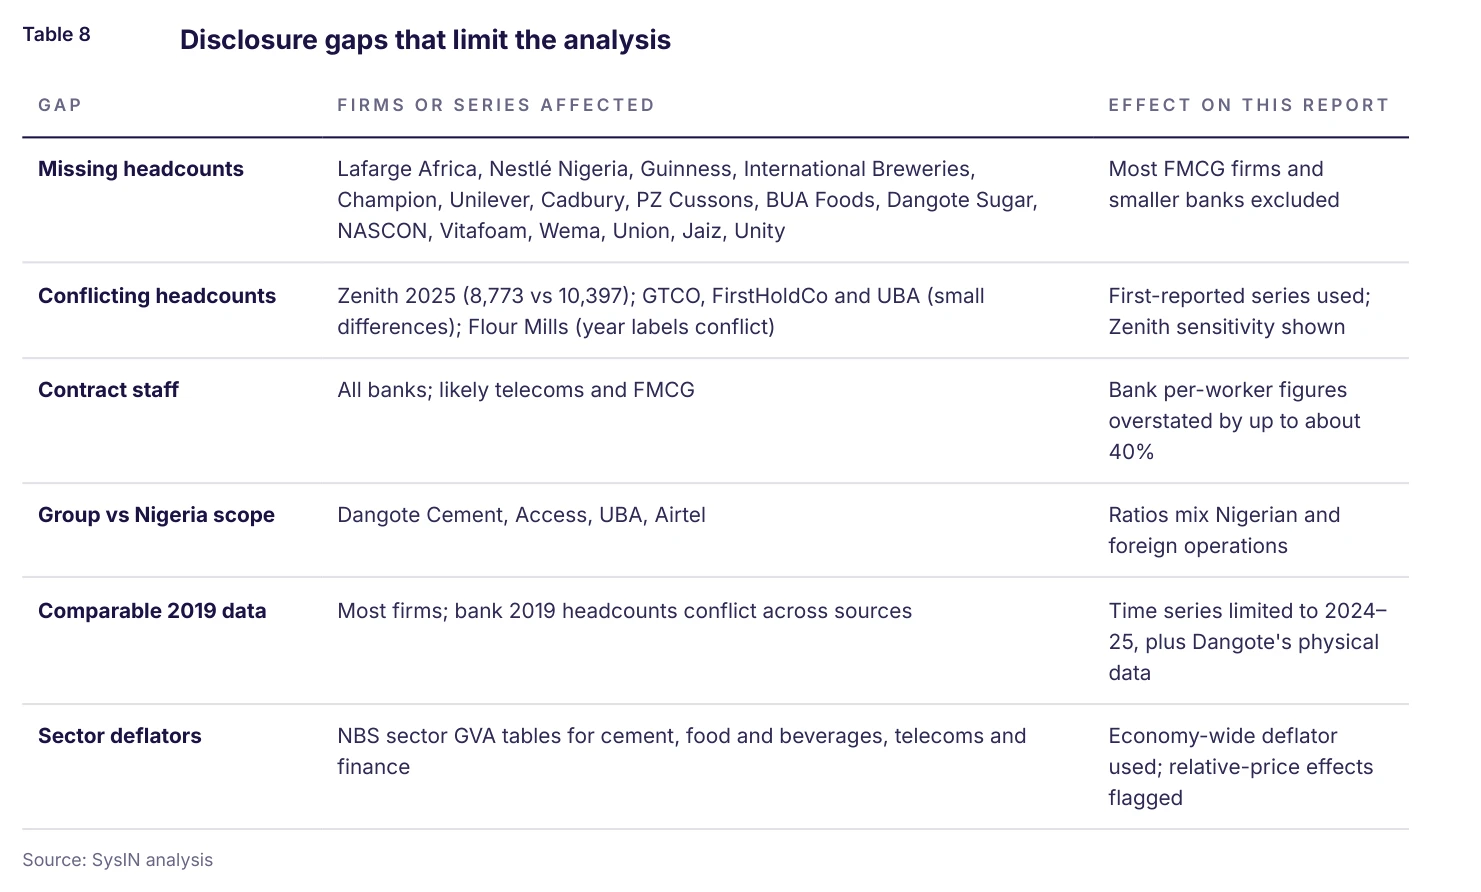
24 Of 34 target firms could not be analysed because of missing or conflicting data
A national version of this study is possible. It needs a modest increase in what firms disclose and what the statistical system publishes.
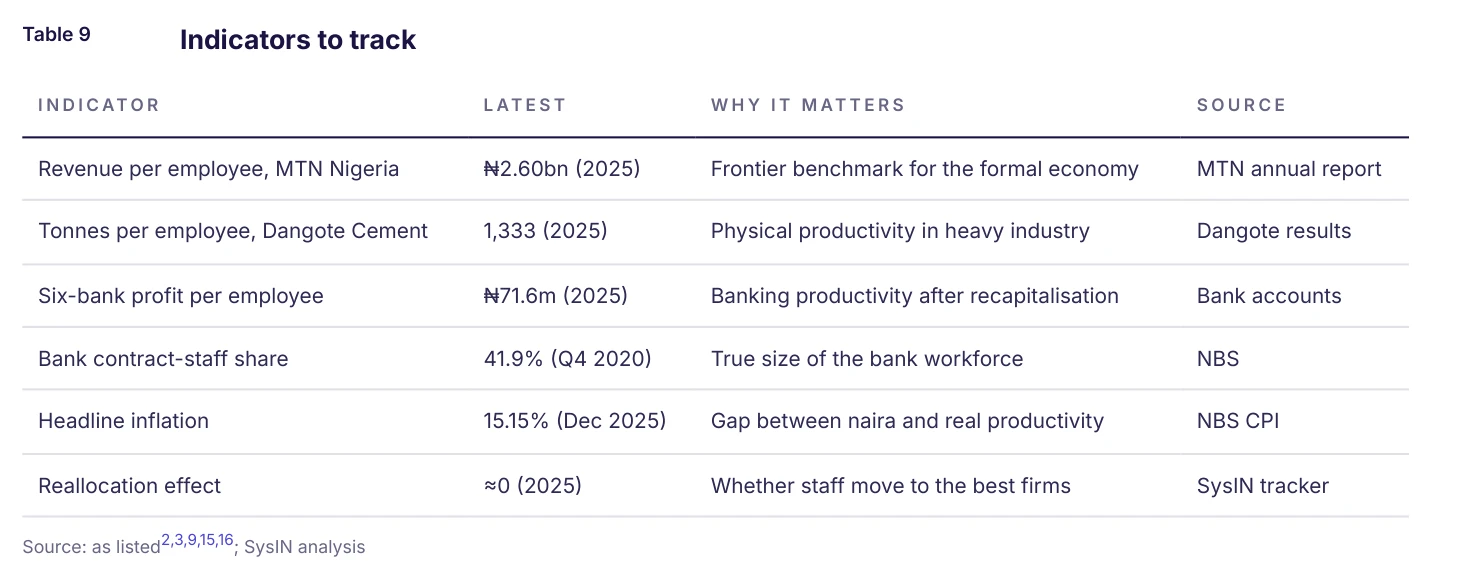
Methodology and data notes
Approach The analysis follows McKinsey Global Institute's The Power of One[1].
MGI measures labour productivity as real gross value added per worker and decomposes national productivity growth into each firm's contribution. We apply the same logic to the Nigerian firms whose disclosures permit it.
Sample We targeted 34 large firms in cement, FMCG and beverages, telecoms and banking. We kept those with consistent headcount and financial data for 2024 and 2025 from audited accounts, results releases or press compilations of audited accounts. Where sources conflict, we used the series consistent across years and show sensitivity where the gap is large. Figures not verified in at least one reliable source are excluded rather than estimated.
Measures Non-financial firms: revenue per employee (all four firms), EBITDA or operating profit per employee, and the value-added proxy, EBITDA plus wages and salaries (MTN Nigeria and Dangote Cement). Banks: gross earnings per employee and profit after tax per employee. Physical productivity: Dangote Cement tonnes per employee and MTN subscribers per employee.
Decomposition For a group of firms, productivity P is the employment-weighted average of firm productivity p. The change in P from 2024 to 2025 is split exactly into firm contributions: Ci = si,2024 × Δpi + Δsi × (pi,2025 – P2024). Here s is employment share. The first term is the within-firm effect, the second the reallocation effect.
Prices Real figures use the NBS GDP implicit deflator from the rebased (2019 = 100) national accounts for 2019–2024[13], extended to 2025 with the 12-month average CPI inflation of 23.01%[15]. This mixes two indices and is approximate. Because sector deflators were not available in usable form, real figures for cement and banking include relative-price effects, which Section 05 addresses with physical data.
Thresholds MGI's Standout threshold of one basis point of national growth suits samples of thousands. With ten firms, we define Standouts as firms whose share of their group's gain is at least twice their share of its employment, and Stragglers as firms responsible for at least a fifth of their group's decline.
Limitations The sample is small, covers the formal corporate core only, and mixes group and Nigerian operations for some firms. Revenue includes bought-in inputs. Bank headcounts largely exclude contract staff. Results are indicative and should not be read as estimates of national productivity.
About SysIN Insights
120k+
SysIN Insights builds institutional-grade macro monitoring platforms for Africa's most important economies, turning fragmented data into decision-ready intelligence.
Economic indicators across SysIN's Macro Monitors
What we do SysIN Insights is an African economic intelligence company. We collect, clean and structure official, market and company data so that decision makers can see how economies, sectors and firms are moving, and act on it.
Our products
Macro Monitors. Subscription platforms with more than 120,000 indicators, live for Nigeria and Ghana. The Nigeria Macro Monitor is at nigeriamacromonitor.com.
Nkem IQ. An AI layer that drafts reports and briefs by reading only SysIN's own verified database, so every answer is traceable to its source.
Research and development. Bespoke sector, country and firm-level studies, such as this report, scoped to each client's research needs.
Website
Nigeria Macro Monitor
sysinafrica.com
nigeriamacromonitor.com
Newsletters. A weekly market update on what happened in the past week, and a twice-monthly narrative deep-dive brief.
Who we serve Banks, consulting and advisory firms, fintechs, government agencies, media organisations, private equity and venture capital investors, and development finance institutions.
About this report This report was prepared by SysIN's Research & Development team. It applies McKinsey Global Institute's firm-level approach to productivity to Nigeria, using disclosed company accounts and official statistics. SysIN can extend the analysis to more firms, sectors and years for clients, and track it over time.
Contact
hello@sysininsights.com
References
[1] McKinsey Global Institute (2025), The power of one: How standout firms grow national productivity, May. mckinsey.com/mgi
[2] MTN Nigeria (2026), FY2025 Earnings Release. mtn.ng/wp-content/uploads/2026/02/MTN-Nigeria-FY-2025-Earnings-Release.pdf
[3] Dangote Cement (2026), FY2025 Results Presentation. cement.dangote.com/wp-content/uploads/2026/03/Dangote-Cement-PLc-Result-Presentation-2025.pdf
[4] Dangote Cement (2020), FY2019 Audited Financial Statements, NGX. doclib.ngxgroup.com
[5] BUA Cement (2026), FY2025 Annual Report, via African Financials. africanfinancials.com/company/ng-buac; CemNet, "BUA Cement reports record revenue". cemnet.com
[6] Nigerian Breweries (2026), Full Year 2025 Audited Financial Statements. nbplc.com
[7] Nestlé Nigeria (2026), Audited Financial Statements for the year ended 31 December 2025, NGX. doclib.ngxgroup.com
[8] Lafarge Africa (2026), FY2025 Press Release, NGX. doclib.ngxgroup.com
[9] Nairametrics (2026), "Zenith Bank FY2025 profit hits ₦1.26 trillion". nairametrics.com
[10] Nairametrics (2026), "Top 10 highest-paying NGX companies by employees' salaries in 2025". nairametrics.com
[11] Nairametrics (2026), "Top 10 NGX-listed companies with the largest employees in 2025". nairametrics.com
[12] Nairametrics (2025), "Top 10 Nigerian companies with the largest number of employees as of 2024". nairametrics.com
[13] National Bureau of Statistics (2025), Rebasing of Gross Domestic Product, July. microdata.nigerianstat.gov.ng
[14] Premium Times (2026), "Nigeria's economy grows 4.07% in Q4 2025". premiumtimesng.com
[15] The Pinnacle (2026), "Nigeria's inflation stood at 15.15% in December 2025 after CPI rebasing — NBS"; 2025 average inflation of 23.01% per NBS. thepinnacleng.com
[16] Pension Nigeria, "Two out of five bank workers are contract staff — NBS" (NBS Selected Banking Sector Data). pensionnigeria.com
[17] Vanguard (2026), "Breweries defy economic hardship, record sharp rise in revenue", May. vanguardngr.com
[18] BusinessDay (2026), "MTN Nigeria rebounds to ₦1.1tn profit as FX gains, data surge lift revenue". businessday.ng
[19] Brand Communicator (2026), "Nestlé Nigeria's return to profit". brandcom.ng
[20] Herrera, S. and Kouamé, W. (2017), Productivity in the non-oil sector in Nigeria: firm-level evidence, World Bank Policy Research Working Paper 8145. papers.ssrn.com
[21] Nairametrics (2025), "FG launches Labour and Empowerment Program, targets creating 2.5 million jobs in two years", 15 April. nairametrics.com
[22] BusinessDay, "Ten takeaways from the 2024 Nigeria Labour Force Survey" (NBS NLFS annual report 2023). businessday.ng
[23] National Bureau of Statistics, Nigeria Labour Force Survey reports, Q2 2023 to Q2 2024. nigerianstat.gov.ng
[24] Nairametrics (2026), "Only 10.5% of Nigerian women have paid jobs — World Bank", 6 April. nairametrics.com